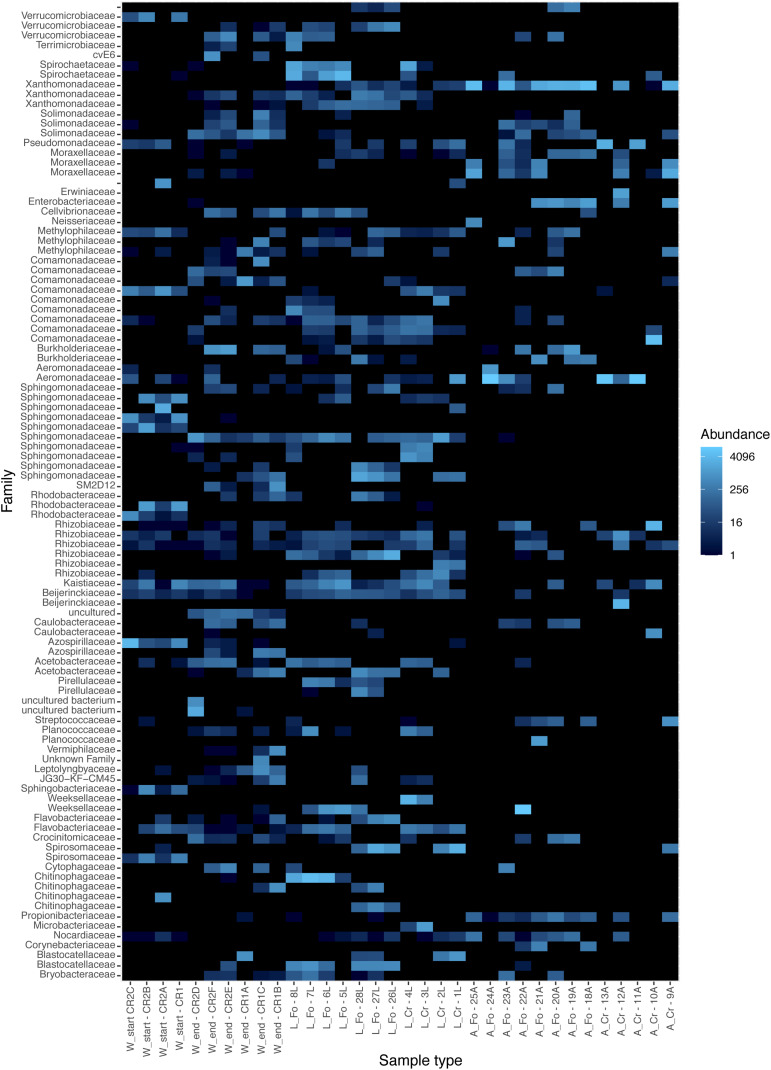
FIGURE 3.
Heatmap showing the relative abundance of the components of the microbiota in the breeding site water, larvae, and adult samples from laboratory and wild-collected mosquitoes. The distribution of the 100 most abundant Amplicon Sequence Variants was explored in each analyzed sample with a heatmap plot based on rarefied tables. Each sample is shown on the X-axis; W refers to water samples, L and A to larvae and adult samples, respectively. Start and End refers to water collected at the moment of mosquito collection and after all adults had emerged, respectively. FO and CR refer to mosquitoes of the Foshan laboratory strain or collected in the wild, respectively. Heatmap colors (from dark to light blue) indicate increasing abundance of each microbiota component. The heatmap was generated with the phyloseq R package.

