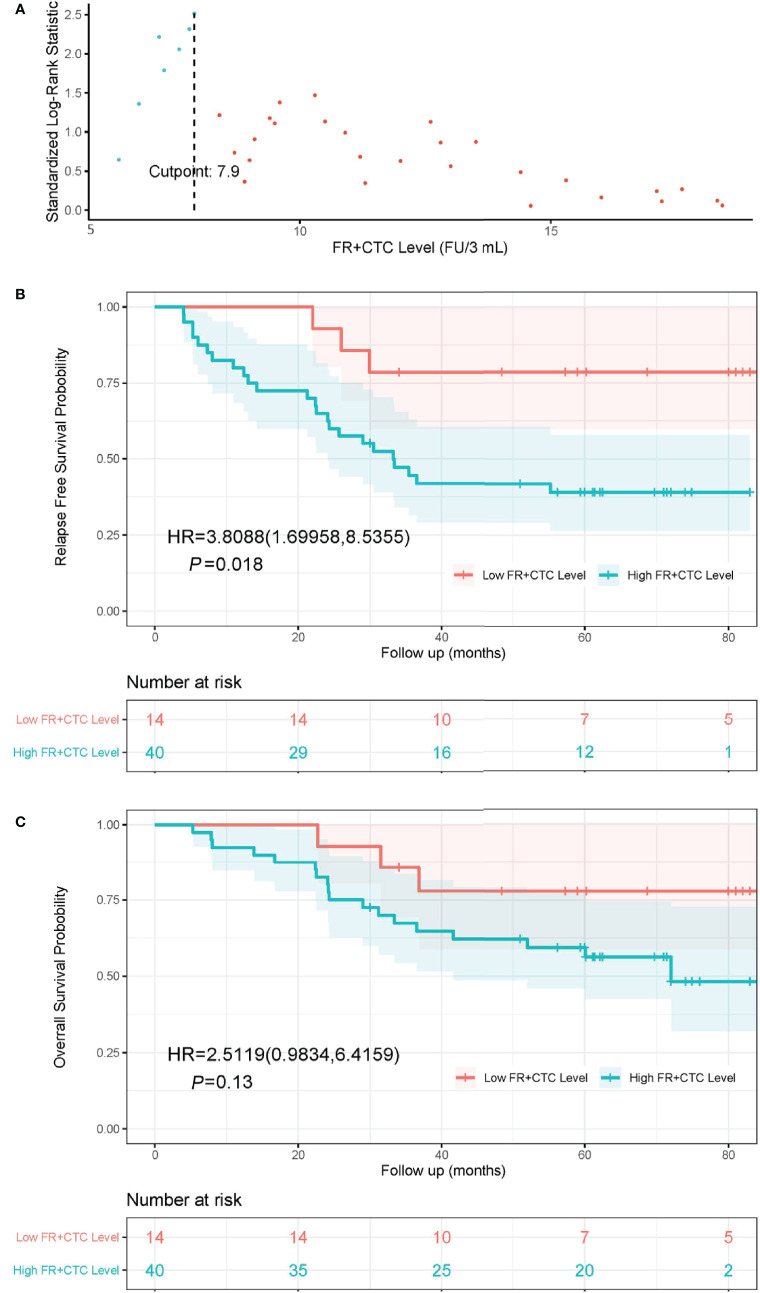
Figure 1.
The cutoff value of FR+CTC level on prognosis and Kaplan-Meier curves of RFS and OS in NSCLC patients with different preoperative FR+CTC level. (A) The standardized statistic of integer valued log-rank scores as a function of the hypothetical cutpoint of FR+CTC level. The process obtains its maximum of 2.5 at 7.9 FU/3 ml as indicated by the dashed line. (B) RFS curve in patients with low (≤ 7.9 FU/3 ml) and high (> 7.9 FU/3 ml) FR+CTC level. (C) OS curve in patients with low (≤ 7.9 FU/3 ml) and high (> 7.9 FU/3 ml) FR+CTC level.

