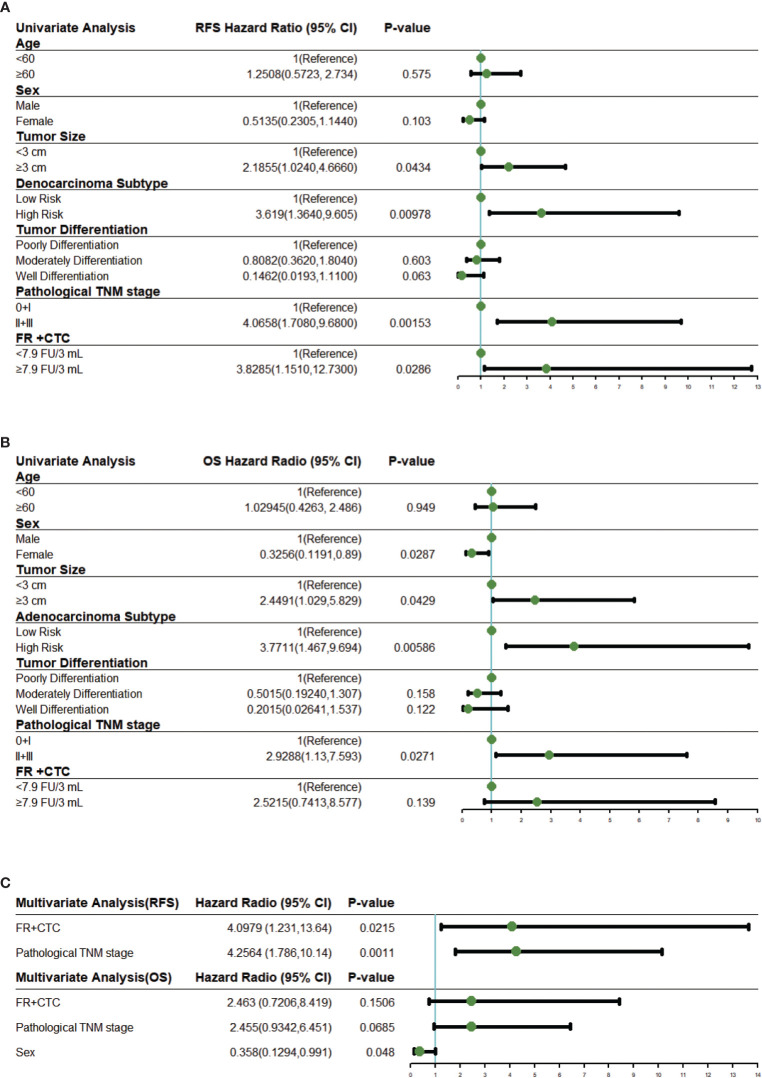
Figure 3.
Univariate and multivariate Cox regression analysis. (A) Forest plots showing the results of univariate regression analysis for RFS. (B) Forest plots showing the results of univariate regression analysis for OS. (C) Forest plots showing the results of multivariate regression analysis for RFS and OS. The x axis represents the hazard radio, and the reference line (blue) and significance were calculated using a Cox proportional hazards model. Error bars, 95% CIs. CI, confidential interval.

