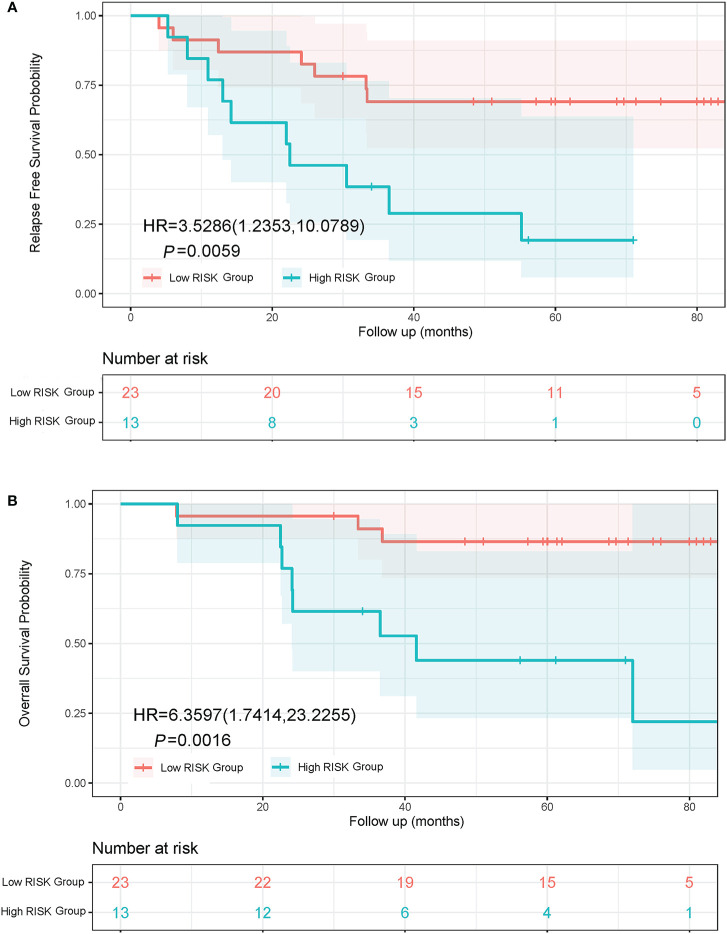
Figure 4.
Kaplan-Meier curves of RFS and OS in lung adenocarcinoma patients with different subtypes. (A) RFS curve of Low Risk Group and High Risk Group. (B) OS curve of Low Risk Group and High Risk Group. The Low Risk Group included adenocarcinoma in situ, minimally invasive adenocarcinoma, and invasive adenocarcinoma predominantly showing lepidic or acinar growth pattern. The High Risk Group included invasive mucinous adenocarcinoma, and invasive adenocarcinoma predominantly showing papillary or solid growth pattern.

