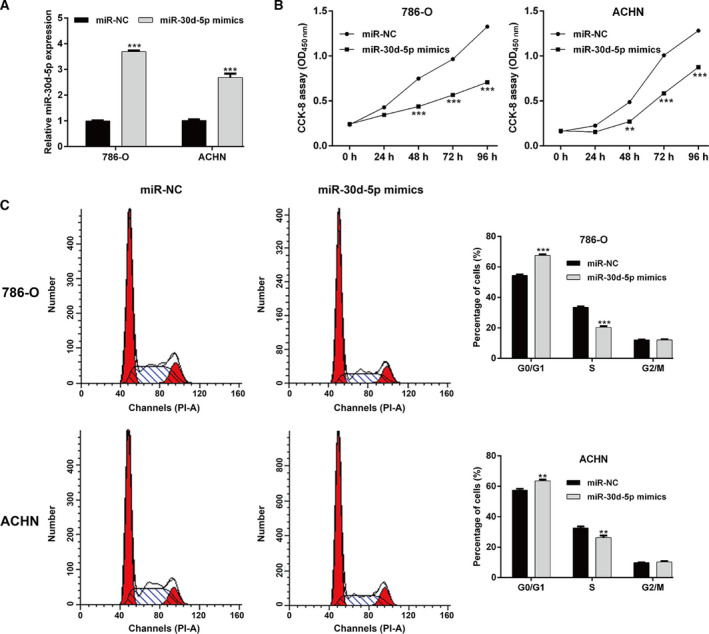
Fig 2.

Effects of miR‐30d‐5p overexpression on cell proliferation and cell‐cycle G1/S transition in RCC cells. 786‐O and ACHN cells were transfected with miR‐30d‐5p mimics or miR‐NC, respectively, for 48 h. (A) The expression of miR‐30d‐5p was determined using qRT‐PCR in transfected 786‐O and ACHN cells. (B) CCK‐8 assay was performed to analyze cell proliferation ability in transfected 786‐O and ACHN cells. (C) The percentage of cells at G0/G1, S and G2/M phases was determined in transfected 786‐O and ACHN cells using flow cytometry with PI staining. Differences between two groups were assessed by Student's t‐test. Data are presented as mean ± SD of three independent experiments. **P < 0.01, ***P < 0.001, compared with miR‐NC.
