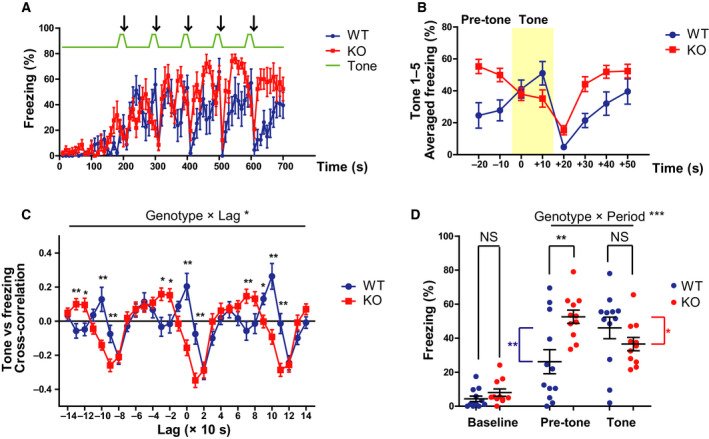
Fig. 2.

Altered freezing behavior in Gad1 KO rats during the conditioning process. (A) The time series of freezing behavior during conditioning on day 1 (WT, n = 12; KO, n = 11). The arrows indicate the timing of the electric shocks. (B) The inverted freezing response of KO rats around the tone‐shock period. The tone period is shaded in yellow. The freezing time courses of all five tone‐shock pairings were averaged to depict the characteristic change in KO rats. (C) Cross‐correlation function between the tone and the freezing time courses. The positive peaks at lag 0 and ±100 s seen in WT rats were undetectable in KO rats. (D) Summary of freezing behavior in each time period. While the freezing behaviors during baseline (0–180 s) and the tone period in KO rats were comparable to those of WT rats, KO rats exhibited significantly excessive freezing during the pretone period. The results are presented as the average ± SEM. Data were analyzed using two‐way ANOVA (C, D) or t‐test (D; baseline only). *P < 0.05, **P < 0.01, ***P < 0.001. In (D), red and blue asterisks represent intragroup significant differences. WT, wild‐type; KO, knockout.
