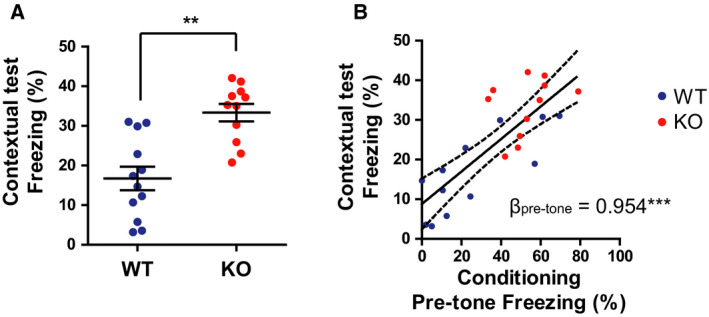
Fig. 3.

Gad1 KO rats displayed enhanced freezing in the contextual test (WT, n = 12; KO, n = 11). (A) Total freezing behavior during the 10‐min contextual test. KO rats displayed significantly higher freezing compared with WT rats. (B) The freezing during the pretone period on day 1 predicted the freezing on the day 2 of contextual test. The solid line and dashed lines represent the regression line and 95% confidence interval of the slope, respectively. βpretone represents the standardized partial regression coefficient. The results are presented as the average ± SEM. Data were analyzed using t‐test (A) or general linear model (B).**P < 0.01, ***P < 0.001. WT, wild‐type; KO, knockout.
