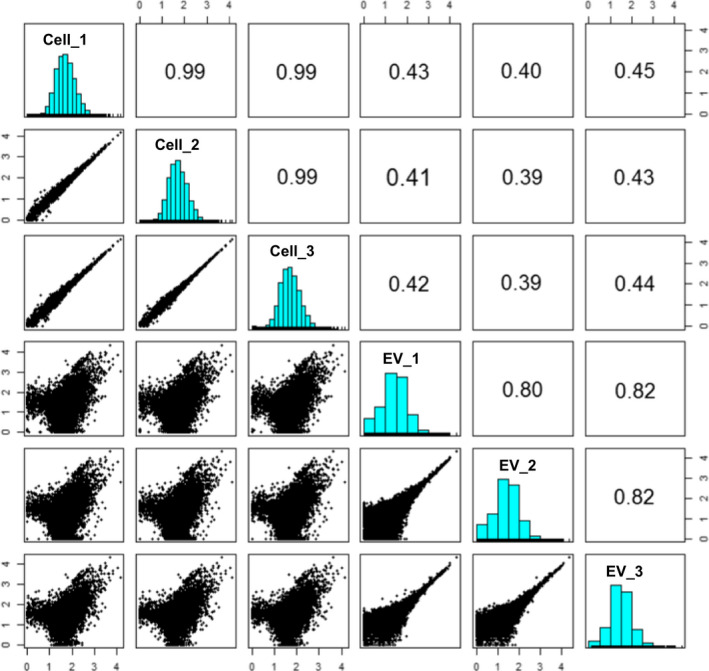
Fig. 3.

Paired panels of correlation in gene expression among samples. CPM of each gene in a sample is plotted and compared with the others in the window. The Pearson's product‐moment correlation coefficient is described in the oppositely plotted window. Digits along the axes of windows represent logarithmic values of CPM.
