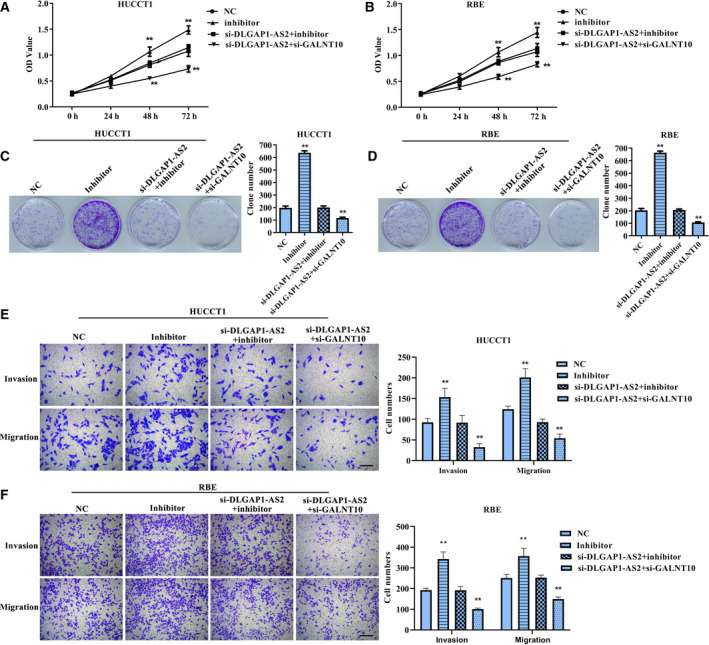
Fig. 4.

The impacts of miR‐505 inhibitor, si‐DLGAP1‐AS2+miR‐505 inhibitor and si‐DLGAP1‐AS2+si‐GALNT10 on malignant phenotype of HUCCT1 and RBE cells. (A,B) CCK‐8 assay for viability of HUCCT1 and RBE cells. **P < 0.01 versus NC group. (C,D) Colony formation assay for proliferation of HUCCT1 and RBE cells. **P < 0.01 versus NC group. (E,F) Transwell assay for migration and invasion of HUCCT1 and RBE cells. **P < 0.01 versus NC group. Scale bar: 200 µm. Error bar represents the mean ± SD derived from three independent experiments. Comparisons between groups were analyzed using t‐tests (two‐sided). OD, absorbance.
