Fig. 1.
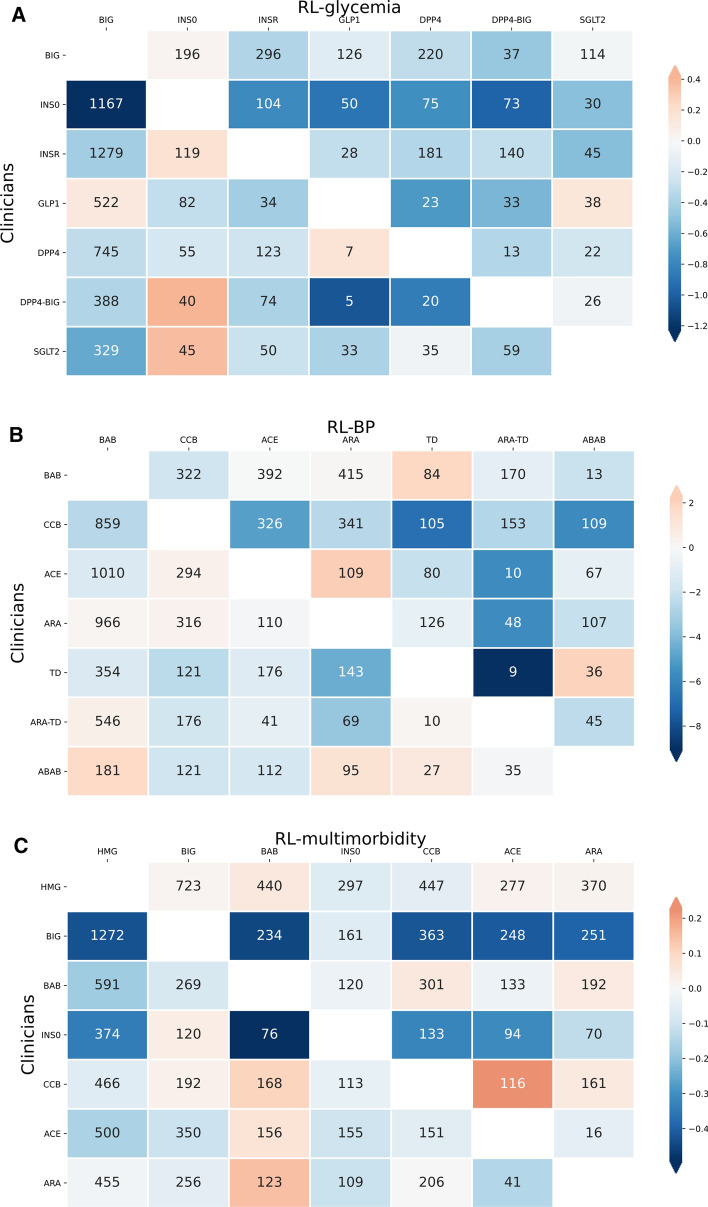
Patterns of the most frequent discrepant RL recommendations and clinicians’ prescriptions for (a) RL–glycemia, (b) RL–BP, and (c) RL–multimorbidity. Each cell and the numbers represent patients for whom RL (labels on the x axis) recommended a different regimen from the regimen given by clinicians (labels on the y axis). The color in each cell quantifies the improvement in health outcomes achieved by the RL recommendation relative to the clinician’s prescription, with blue indicating benefits of the RL recommendation and orange indicating worsening outcomes relative to the clinician’s prescription. (a) Indicates the mean A1c reduction (%) of RL–glycemia (labels on the x axis) compared with clinicians (labels on the y axis); (b) indicates the mean SBP decrease (mmHg) of RL–BP (labels on the x axis) compared with clinicians (labels on the y axis); and (c) indicates the mean difference of multimorbidity reward from RL–multimorbidity (labels on the x axis) compared with clinicians (labels on the y axis). RL–CVD was consistent with clinicians’ prescriptions for the vast majority of encounters, and thus was not shown in this figure. RL reinforcement learning, SBP systolic blood pressure

