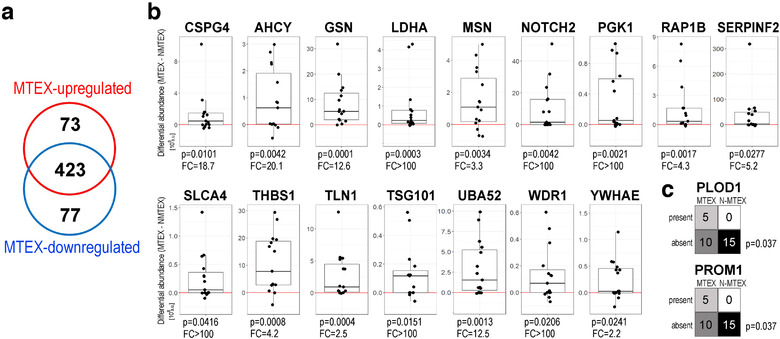
FIGURE 2.

MTEX proteins found to have significantly upregulated levels relative to NMTEX. Panel a – the Venn diagram showing numbers of proteins upregulated or downregulated in MTEX. Panel b – individual differences in the protein levels between paired samples of MTEX and NMTEX; boxplots show median, upper and lower quartile, maximum and minimum (dots represent individual patients; the red line represents no difference between MTEX and NMTEX, FC – average fold‐change). Panel c – PLOD1 and PROM 1 are shown as examples of the present/absent status analysis of proteins in paired samples of MTEX and NMTEX
