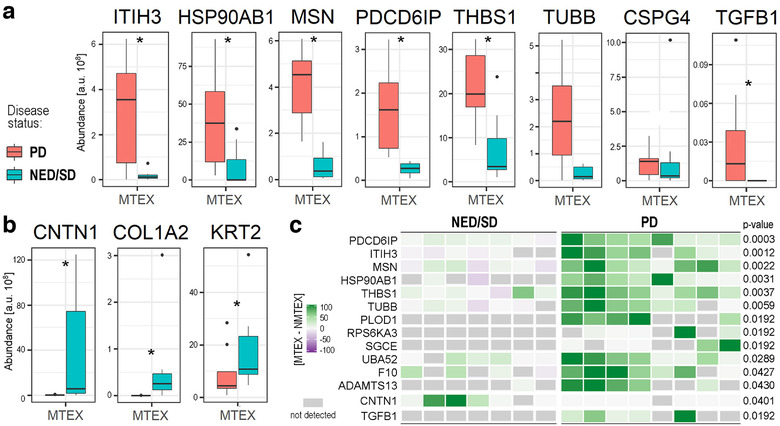
FIGURE 5.

sEV‐associated proteins that were present at a significantly different level in MTEX isolated from plasma of melanoma patients with PD relative to MTEX isolated from plasma of melanoma patients with NED/SD. Panel a – MTEX proteins with significantly higher levels in patients with PD. Panel b – MTEX proteins with significantly higher levels in patients with NED/SD. Boxplots show median, upper and lower quartile, maximum, and minimum; dots represent outliers. The statistical significance of differences between patient subgroups (P < 0.05) is marked with asterisks. Panel c – A heat map presenting the differential (MTEX‐NMTEX) protein levels in individual melanoma patients with NED/SD (n = 7) or PD (n = 8). Twelve proteins found to be upregulated in MTEX of melanoma patients with PD are listed. Moreover, the levels of CNTN1 and TGFβ1 are presented in the corresponding samples. The relative levels of the listed proteins is colour‐coded where gray boxes represent not detected proteins; P‐values represent the significance of the difference between patients’ subgroups of the differential (MTEX‐NMTEX) value
