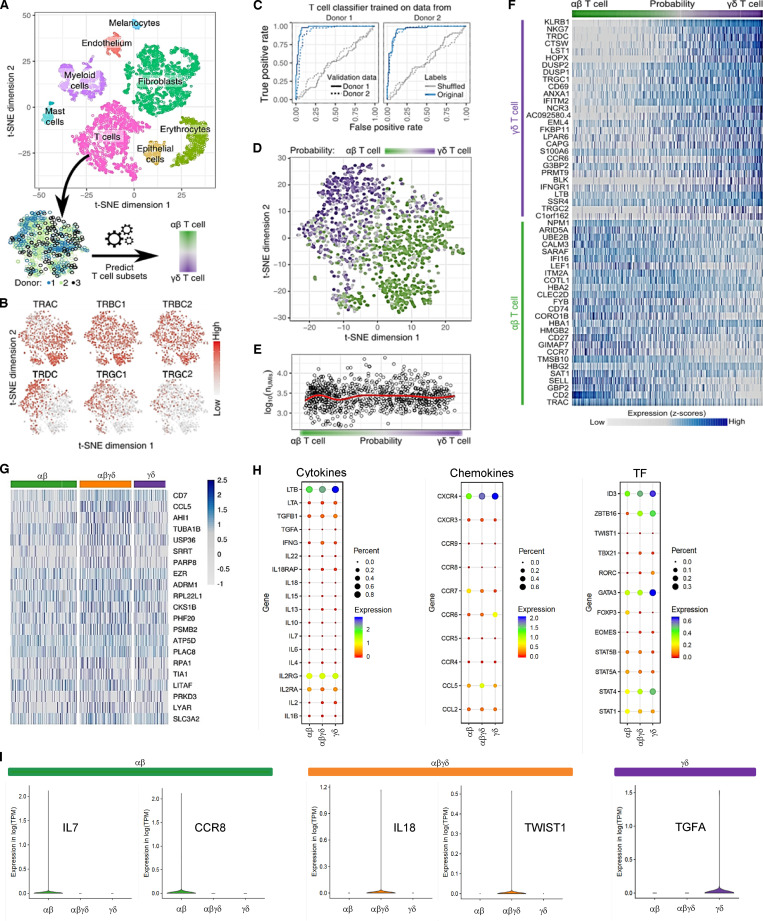
Figure 1.
Identification of an unconventional T cell population in fetal skin using single-cell analyses. (A) Clusters in the t-SNE blot were assigned to all identified cell types. From the full dataset, T cell subsets were extracted throughout three donors (17–22 wk EGA). (B) Expression of TCR subunits across T cell subsets. (C) Prediction accuracy for αβ and γδ T cells from expression data are demonstrated as the ROC curve. Predictors of one donor were tested on the same donor using nested cross-validation and across donors. Prediction accuracy was also compared with data with shuffled labels. Probability scores of 0 and 1 indicate αβ and γδ T cells, respectively. (D) t-SNE clustering of T cell subsets from three donors, with color-coded probability of cells representing αβ or γδ T cells. (E) T cell probability compared with data quality, measured as the number of UMIs. Red line shows a local regression fit through data. (F) Marker genes in αβ and γδ T cells. (G) Heatmap showing highest gene expression levels in DP αβγδ fetal skin T cells in comparison to SP T cell subsets. (H) Dot plots of fetal skin T cell subsets displaying average gene expression (colors) and frequency (circle size) of selected cytokines, chemokines, and transcription factors (TF). (I) Exclusive expression of indicated genes in SP and DP T cell subsets. Means of the average expression levels are indicated by color.

