Figure 2.
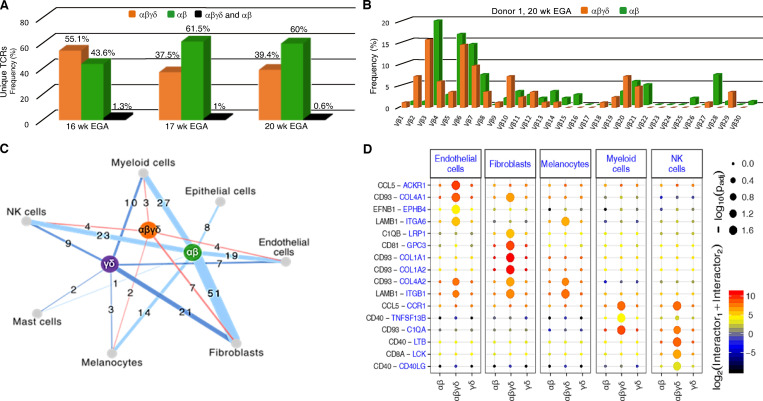
TCR sequencing data and in silico receptor–ligand interaction studies. (A) Comparative analysis of CDR3 sequences demonstrate rearrangements exclusively in DP αβγδ T cells (orange), SP αβ T cells (green), and both fetal skin T cell subsets (black; n = 3). (B) Frequency distribution of DP αβγδ and SP αβ T cell clones according to their constituent Vβ family member in one of three donors. (C) Cell networks with potential interactions of T cell subsets in fetal skin (n = 3). (D) Overview of selected TCR–ligand interactions; P values indicated by circle size; scale on right (permutation test). Means of the average expression level of interactions are indicated by color. Only droplet data were used (n = 3 biological replicates).

