Figure 3.
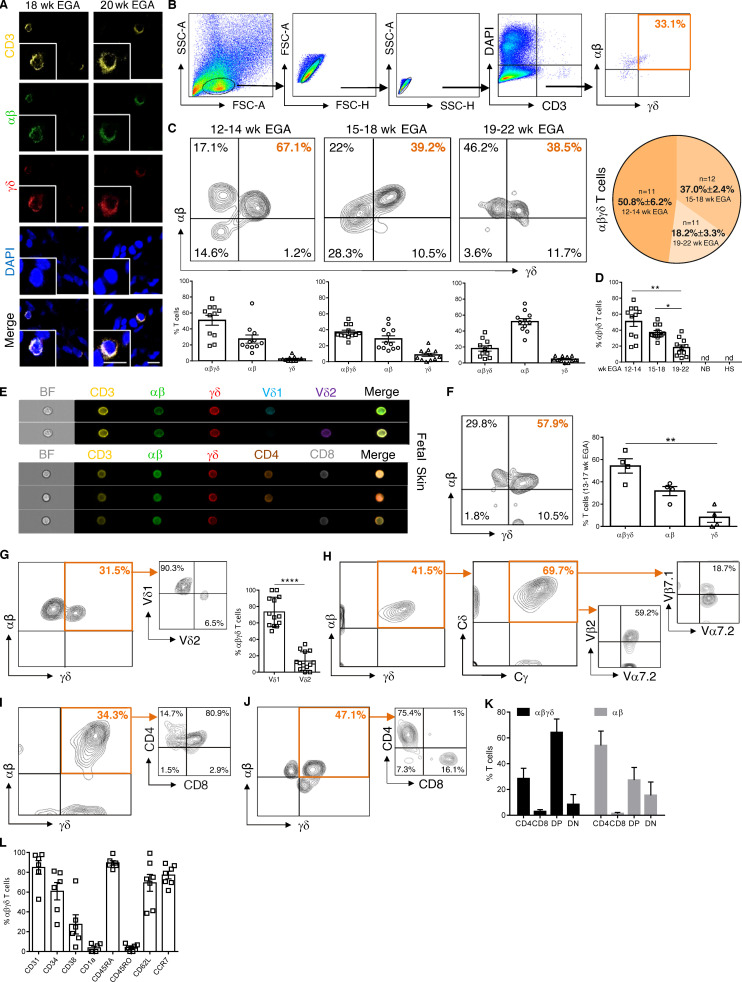
Fetal skin harbors an exclusive T cell subset. (A) Representative confocal microscopy images of whole-mount fetal skin showing DP αβγδ T cells in situ (n = 9). Scale bars, 10 µm. (B) Biaxial plots demonstrating the gating strategy for DP αβγδ T cells. (C) Representative plots showing DP αβγδ fetal skin T cells analyzed by flow cytometry. Kinetics and quantification of fetal skin T cell subsets during gestation (n = 34). (D) Bars revealing DP αβγδ T cells during gestation compared with newborn skin (NB, n = 3) and hypospadiasis skin (HS; n = 3). Each data point in the scatter plots represents an individual experiment and donor. (E and F) Imaging flow cytometry of DP αβγδ fetal skin T cells for indicated markers (n = 4, 13–17 wk EGA) and quantification of fetal skin T cell subsets. (G) Representative contour plots and percentage of Vδ1 and Vδ2 expression on DP αβγδ T cells in fetal human skin (n = 13). (H) Representative plots showing DP αβγδ T cells analyzed for the expression of δ/γ constant (identifying TCR γδ) and selected Vα/Vβ families (identifying TCR αβ; n = 5). (I–K) Percentage of CD4−CD8− (DN), CD4+CD8+ (DP), CD4+, and CD8+ T cells within DP αβγδ and SP αβ T cells (n = 25). (L) Characterization of DP αβγδ T cells for indicated markers. Tukey's multiple comparison test; *, P < 0.05; **, P< 0.01; ****, P < 0.0001. Mean ± SEM.

