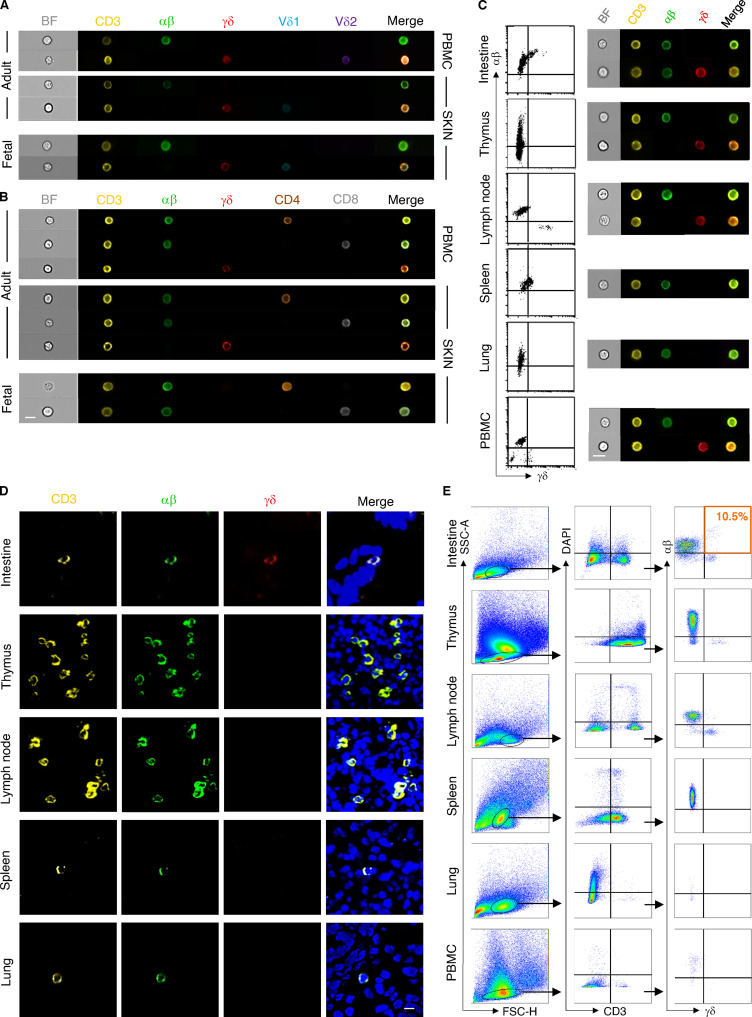
Figure S2.
Comparative analysis of T cells in fetal organs and PBMCs. (A and B) Representative images of cell types showing brightfield (BF) and immunofluorescence (CD3/αβ/γδ/Vδ1/Vδ2/CD4/CD8) as analyzed using ImageStream (n = 4). (C and E) Representative biaxial plots demonstrating the gating of T cell subsets in fetal organs and PBMCs as well as analysis by ImageStream and flow cytometry (n = 5). (D) Representative confocal laser microscopy images showing a T cell marker expression profile in indicated fetal organs (n = 4). Scale bar, 10 µm.

