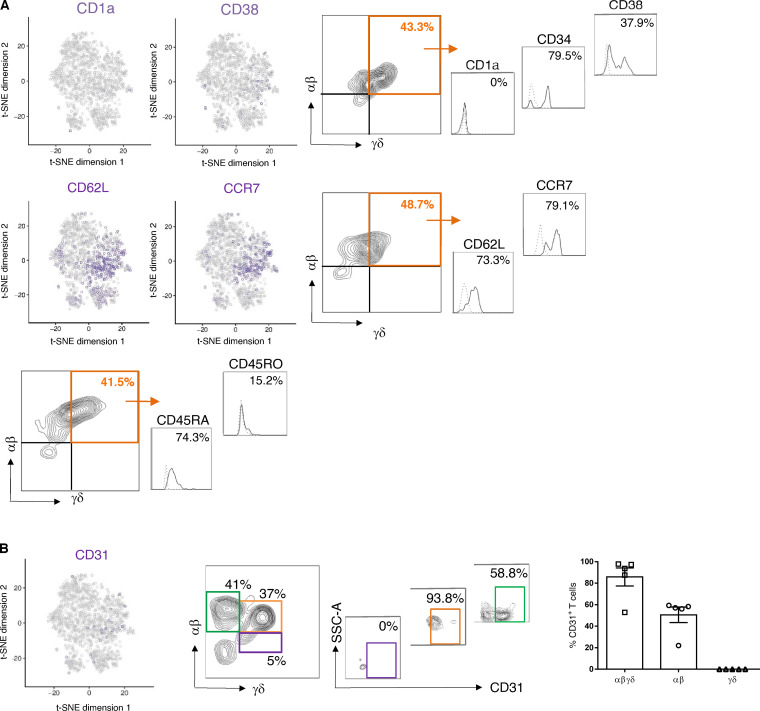
Figure S3.
Phenotypic characterization of DP αβγδ T cells in fetal human skin. Biaxial plots and histograms depict one representative experiment. (A and B) t-SNE blots of indicated genes in DP αβγδ fetal skin T cells. Histograms show expression of selected hematopoietic stem cell and progenitor markers on DP αβγδ fetal skin T cells analyzed by flow cytometry (n = 5–7).

