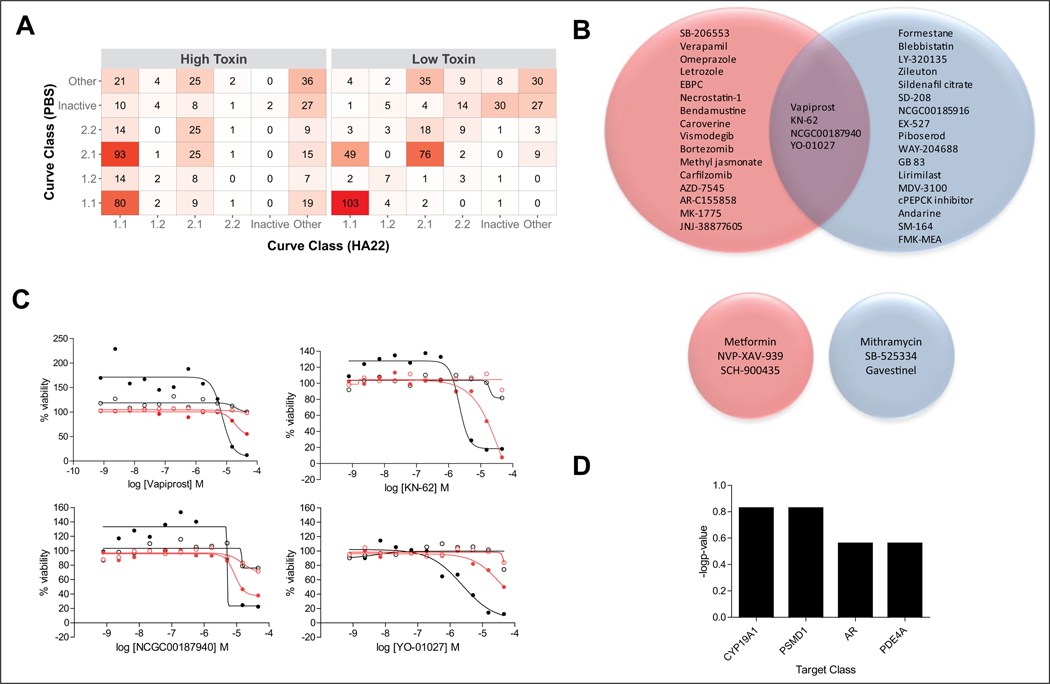
Figure 1.
Selection of compounds based on curve class (CC) analysis. (A) Correlation table of number of compounds in each CC for the synthetic lethal quantitative high-throughput screening (qHTS) for HA22 enhancers and mitigators. The higher the number of compounds in a CC correlation box, the darker the red color. Each CC bin includes both positive and negative curve classes. The “Other” bin includes CCs ±1.3, ±1.4, ±2.3, ±2.4, ±3, and 5. (B) Venn diagram of enhancer hits selected based on HA22-treated CCs −1.1, −2.1, −1.2, and −2.2 and vehicle-treated CC 4 (top Venn diagrams), as well as mitigator hits selected based on HA22-treated CCs 1.1, 2.1, 1.2, and 2.2 and vehicle-treated CC 4 (bottom Venn diagrams). Red circles correspond to high HA22 dose treatment arm, and blue circles correspond to low HA22 dose treatment arm. (C) Dose responses of the four enhancer compounds that overlap between low and high HA22 dose treatment. Solid black circles are high-dose HA22 treatment arm; open black circles are for the corresponding vehicle arm; solid red circles are low-dose HA22 treatment arm; open red circles are the corresponding vehicle arm. (D) Bar graph of the target classes enriched (−log p-value) for the 36 enhancer hits identified using the CC method. Complete list of hit compounds is included in supplemental material.

