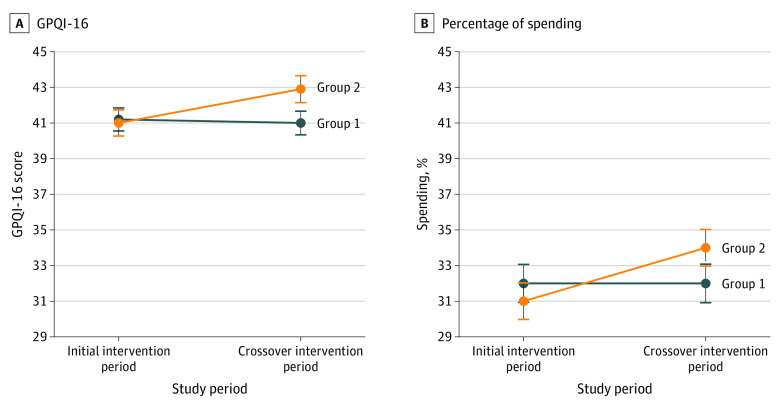
Figure 2. Grocery Purchase Quality Index (GPQI)–16 Scores and Percentage Spending on Targeted Food Groups Among 209 Smart Cart Study Participants.
Data points are means, with SEs denoted with error bars. Group 1 (104 participants) was randomized to receive personalized coupons in the initial intervention period followed by an active control in the crossover intervention period. Group 2 (105 participants) was randomized to receive the active control in the initial intervention period followed by personalized coupons in the crossover intervention period.

