
Figure 3. Monthly Grocery Purchase Quality Index (GPQI)–16 Scores and Percentage Spending on Targeted Food Groups.
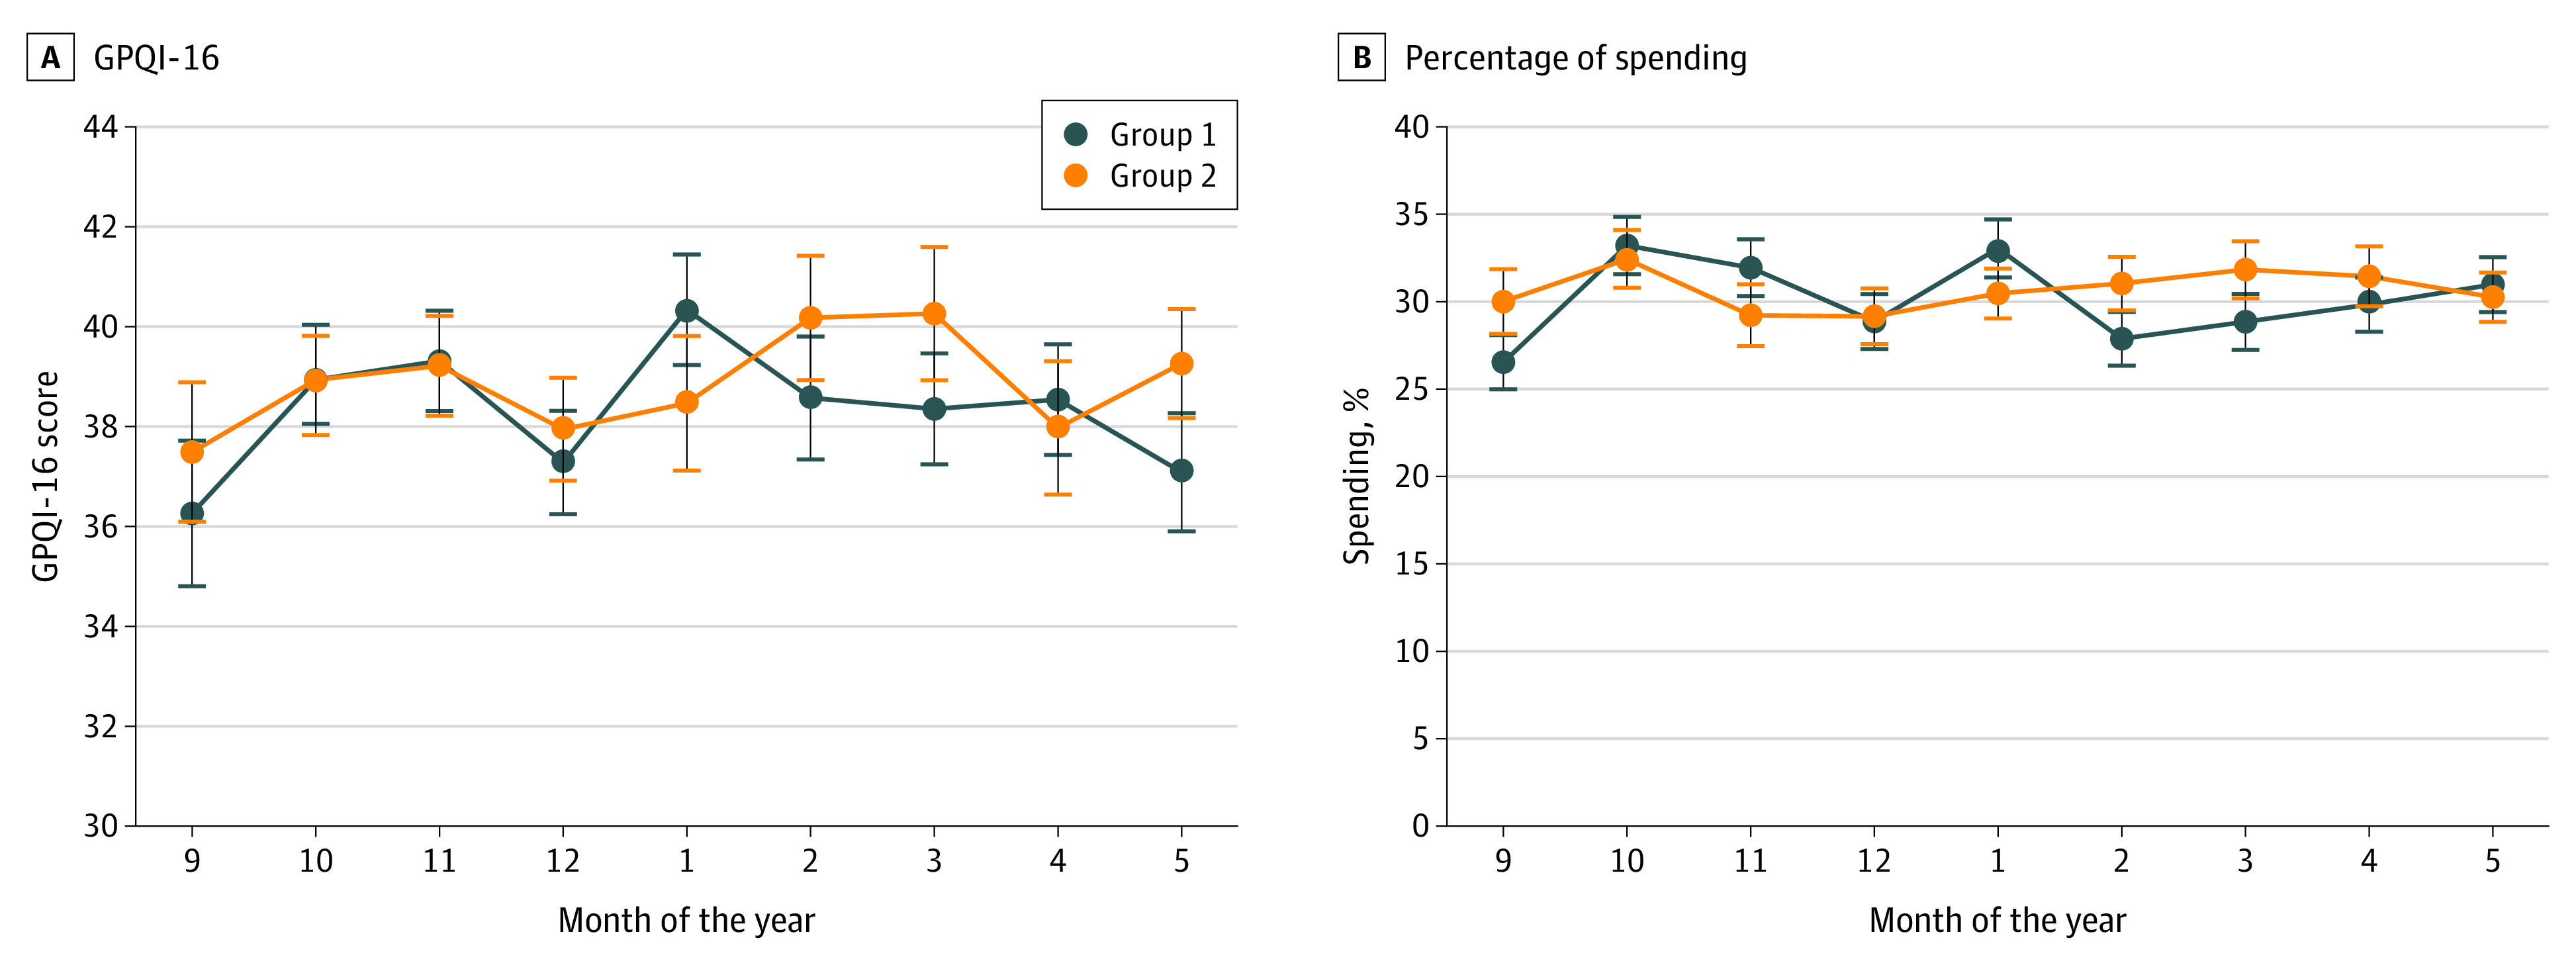
Data points are means, with SEs denoted with error bars. Group 1 (104 participants) was randomized to receive personalized coupons in the initial intervention period followed by an active control in the crossover period. Group 2 (105 participants) was randomized to receive the active control in the initial intervention period followed by personalized coupons in the crossover period. The x-axis (months) shows the study duration from September 2018 through May 2019; the end of the initial intervention period occurred in December 2018, and the beginning of the crossover intervention period occurred in February 2019.