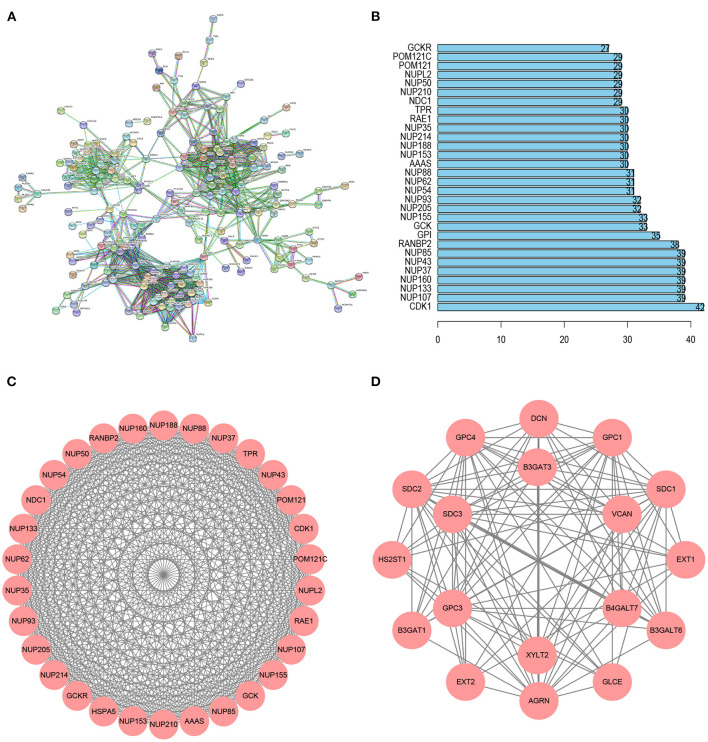
Figure 3.
PPI network analysis of glycolysis-related genes. (A) The PPI network including 188 node and 1,157 edges. (B) Histogram of the top 30 genes in the PPI network. (C) Module 1 included 30 nodes and 430 edges with a score of 29.655. (D) Module 2 included 18 nodes and 114 edges with a score of 13.412.

