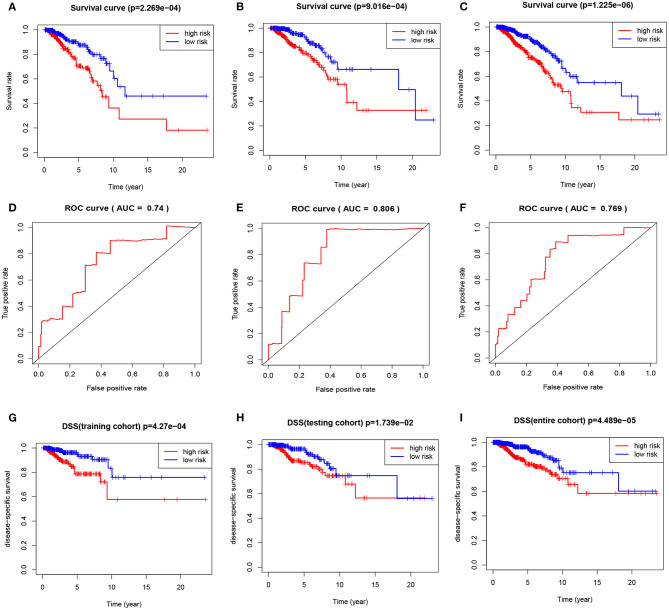
Figure 5.
The four-mRNA signature predicts the prognosis of BRCA patients. (A) Kaplan-Meier curve of OS in the training cohort. (B) Kaplan-Meier curve of OS in the testing cohort. (C) Kaplan-Meier curve of OS in the entire cohort. (D) ROC curve of training cohort. (E) ROC curve of testing cohort. (F) ROC curve of entire cohort. (G) DSS curve of training cohort. (H) DSS curve of testing cohort. (I) DSS curve of entire cohort.

