
Exhibit 4. Percent differences in total days of opioid prescribing of one or more restrictions on direct-to-physician pharmaceutical marketing, 2013–16.
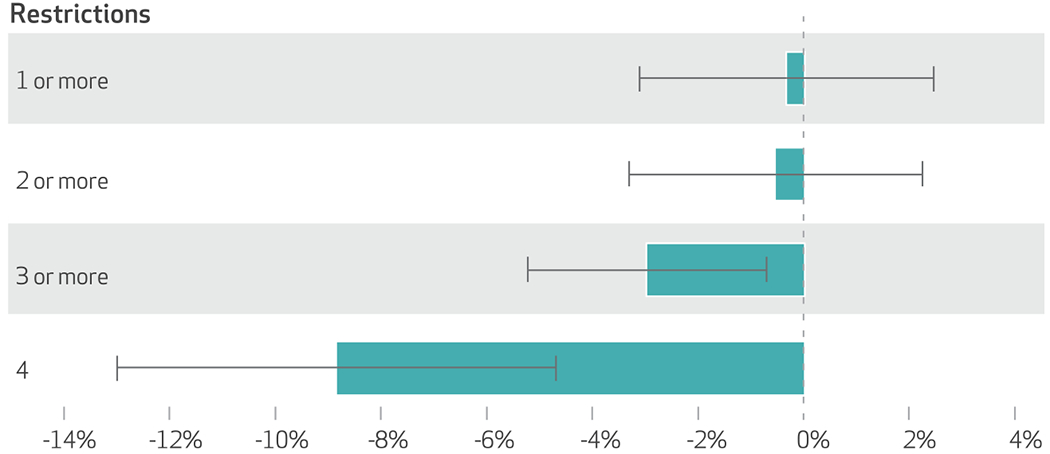
source Authors’ analysis of data for 2013–16 from the Medicare Part D Prescriber Public Use File. notes Numbers of prescribers and prescriber-years are in the notes to exhibit 2. The four restrictions are explained in the text. The exhibit presents semi-elasticity marginal effects from two-part models (explained in the text) that were estimated at the physician-year level. The error bars represent 95%confidence intervals. Standard errors and covariates are explained in the notes to exhibit 3. Year and academic calendar year fixed effects are included in every model.