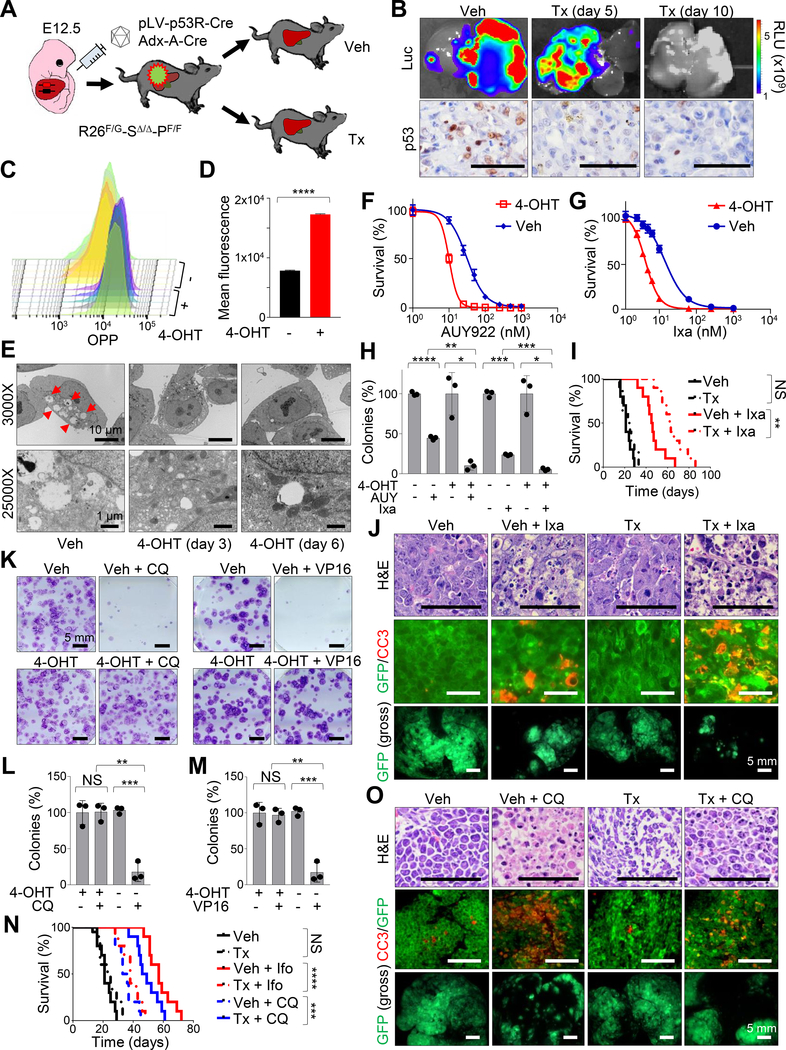
Figure 5. Trp53 ablation drives a significant increase in protein biosynthesis and suppression of autophagy in Smarcb1-deficient tumors.
A) Schematic model showing the experimental workflow. E12.5 Rosa26FlpoERT2/LSL-Gfp-Smarcb1LoxP/LoxP-Trp53Frt/Frt (R26F/G-SΔ/Δ-PF/F) were transduced with the pLV-p53R-Cre lentiviral reporter or the Adx-A-Cre adenoviral vector. Secondary orthotopic transplants were generated in Rag2−/− recipients and assigned to vehicle or tamoxifen treatment to establish Trp53 deficient and proficient isogenic lines. Transplanted mice were treated with tamoxifen or vehicle control one day after surgery. B) Top panels: luciferase imaging showing the activity of the pLV-p53R-Cre lentiviral reporter in vivo upon Trp53 ablation as indicated in (A). Bottom panels: immunohistochemical analysis of p53 levels in tumors described above. C-D) FACS analysis (C) and quantification (D) of OPP incorporation in short-term cultures established from R26F/+-SΔ/Δ-PF/F tumors (n = 5/group). Cells were assessed for OPP incorporation 96 hr post treatment with 4-OHT or vehicle. E) Representative TEM sections from short-term cultures established from R26F/+-SΔ/Δ-PF/F tumors. Red arrowheads: autophagic vacuoles. F-G) In vitro evaluation of cell viability in short-term cultures established from R26F/+-SΔ/Δ-PF/F tumors after 72 hr of treatment with different concentrations of NVP-AUY-922 (F) or ixazomib (G). H) Quantification of colony formation assays from short-term cultures established from R26F/+-SΔ/Δ-PF/F tumors (n = 3/group). The number of colonies was expressed as a percentage of the vehicle treated controls. Pharmacological studies in F, G, H were started 96 hr after treatment with 4-OHT to ablate Trp53 or vehicle control. I) Kaplan-Meier analysis of survival in Rag2−/− mice orthotopically transplanted with R26F/G-SΔ/Δ-PF/F tumors and assigned to treatment with tamoxifen, ixazomib or the combination (n = 10/group). Tamoxifen treatment was started one day after transplantation. Pharmacological treatments were started 7 days after transplantation. J) Representative sections of orthotopic MRTL transplants of R26F/G-SΔ/Δ-PF/F tumors (induced using Adx-A-Cre) treated with vehicle and tamoxifen alone or in combination with ixazomib. Top panels: hematoxylin-eosin staining. Middle panels: co-immunofluorescence staining for GFP (tumor cells) and Cleaved Caspase-3 (apoptotic cells). Bottom panels: gross fluorescence visualization of liver tumors. Tumors were harvested for analysis after 10 days of pharmacological treatment. K) Representative images of colony formation assays from short-term cultures established from R26F/+-SΔ/Δ-PF/F tumors treated with vehicle or 4-OHT alone or combined with VP16 or chloroquine. Pharmacological studies were started 96 hr after treatment with 4-OHT to ablate Trp53 or vehicle control. L-M) Quantification of colonies from triplicate experiments of cultures treated with chloroquine (L) or VP16 (M) as described in K (n = 3/group). The number of colonies was expressed as a percentage of the vehicle treated controls. N) Kaplan-Meier analysis of survival in Rag2−/− mice orthotopically transplanted with R26F/G-SΔ/Δ-PF/F tumors and assigned to the treatment regimens reported in the panel (n = 20 for vehicle and tamoxifen controls, n = 10 for other groups). O) Representative sections of orthotopic transplants of R26F/G-SΔ/Δ-PF/F tumors (induced using Adx-A-Cre) treated with vehicle and tamoxifen alone or in combination with chloroquine. Top panels: hematoxylin-eosin staining. Middle panels: co-immunofluorescence staining for GFP (tumor cells) and Cleaved Caspase-3 (apoptotic). Bottom panels: gross fluorescence visualization of liver tumors. Tumors were harvested for analysis after 10 days of treatment with ixazomib. * p < 0.05, ** p < 0.01, *** p < 0.001, **** p < 0.0001, NS = not significant by unpaired two-tailed t-test (D, H, L, M) and Mantel-Cox test (I, N). Pooled data are presented as mean ± the standard deviation of technical replicates. Size bars: 100 μm unless otherwise specified in panel. See also Figure S5.

