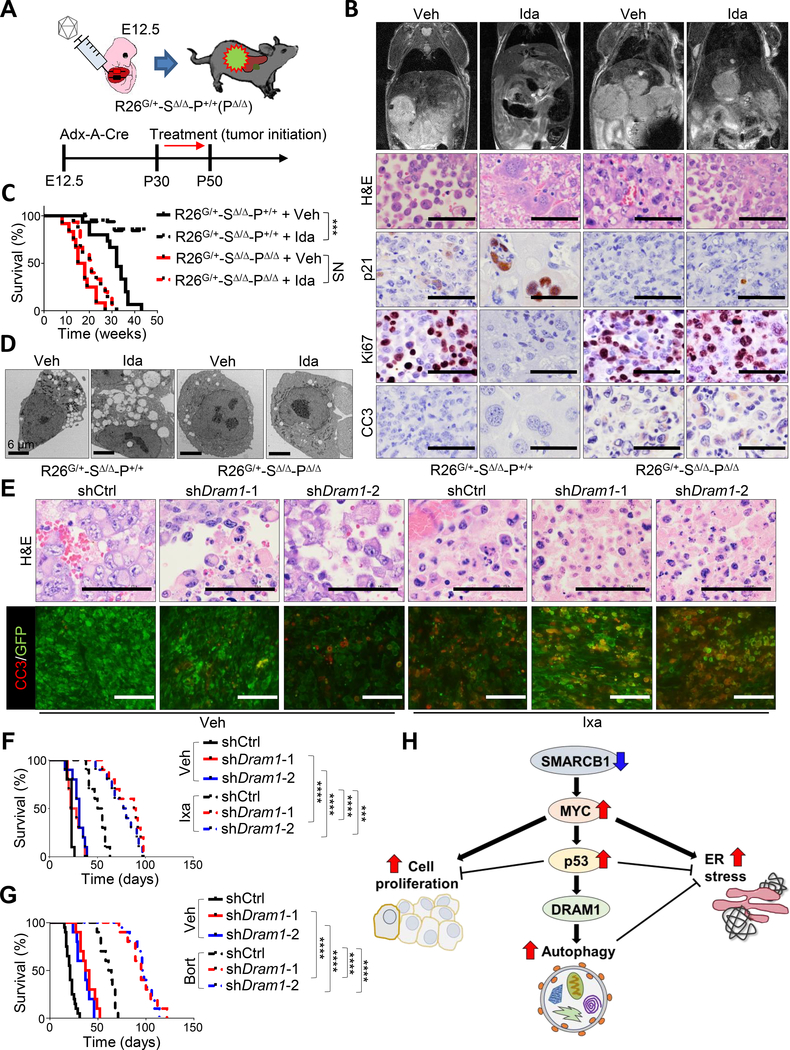
Figure 6. p53 activates autophagy through DRAM1 in Smarcb1-deficient tumors.
A) Schematic model of the experimental workflow to demonstrate a proficient p53 check-point in murine MRTL. E12.5 Rosa26LSL-Gfp/+-Smarcb1LoxP/LoxP-Trp53+/+ (R26G/+-SΔ/Δ-P+/+) embryos were transduced with the Adx-A-Cre construct and assigned to vehicle or treatment with the MDM2 inhibitor idasanutlin at postnatal day 30. Daily dosage was continued for 3 weeks. Rosa26LSL-Gfp/+-Smarcb1LoxP/LoxP-Trp53LoxP/LoxP (R26G/+-SΔ/Δ-PΔ/Δ) were used as controls. B) Top panels: representative coronal T2-weighted MRI sections of tumor-bearing mice treated as described in (A). Bottom panels: histomorphological and immunohistochemical characterization of lesions harvested from Trp53 deficient and proficient tumor-bearing mice. Cell proliferation was assessed by Ki67 immunostaining. Apoptosis was assessed by Cleaved Caspase-3 immunostaining. Tumors were harvested after 10 days of treatment with idasanutlin. C) Kaplan-Meier analysis of survival in mice receiving oral idasanutlin or vehicle (R26G/+-SΔ/Δ-P+/+ + vehicle: n = 15, R26G/+-SΔ/Δ-P+/+ + idasanutlin: n = 17, R26G/+-SΔ/Δ-PΔ/Δ + vehicle: n = 12, R26G/+-SΔ/Δ-PΔ/Δ + idasanutlin: n = 15). D) Representative TEM sections from Trp53 proficient and deficient MRTs. E) Representative hematoxylin-eosin staining and co-immunofluorescence staining for GFP (tumor cells) and Cleaved Caspase-3 (apoptosis) in control and Dram1-silenced R26G/+-SΔ/Δ orthotopic transplants in Rag2−/− recipient mice treated with ixazomib and vehicle. Tumors were harvested for analysis after 10 days of treatment. F-G) Kaplan-Meier analysis of survival in control and Dram1-silenced R26G/+-SΔ/Δ orthotopic transplants in Rag2−/− recipient mice. Experimental cohorts were assigned to treatment with vehicle and ixazomib (n = 10/group) (F) or bortezomib (shCtrl + vehicle: n = 20, other groups: n = 10) (G). H) Schematic model showing the integrated function of MYC-p53-DRAM1 axis in the regulation of proteostasis within the SMARCB1 oncogenic network. *** p < 0.001, **** p < 0.0001, NS = not significant by Mantel-Cox test (C, F, G). Size bars: 100 μm unless otherwise specified in panel. Ida: idasanutlin. See also Figure S6.

