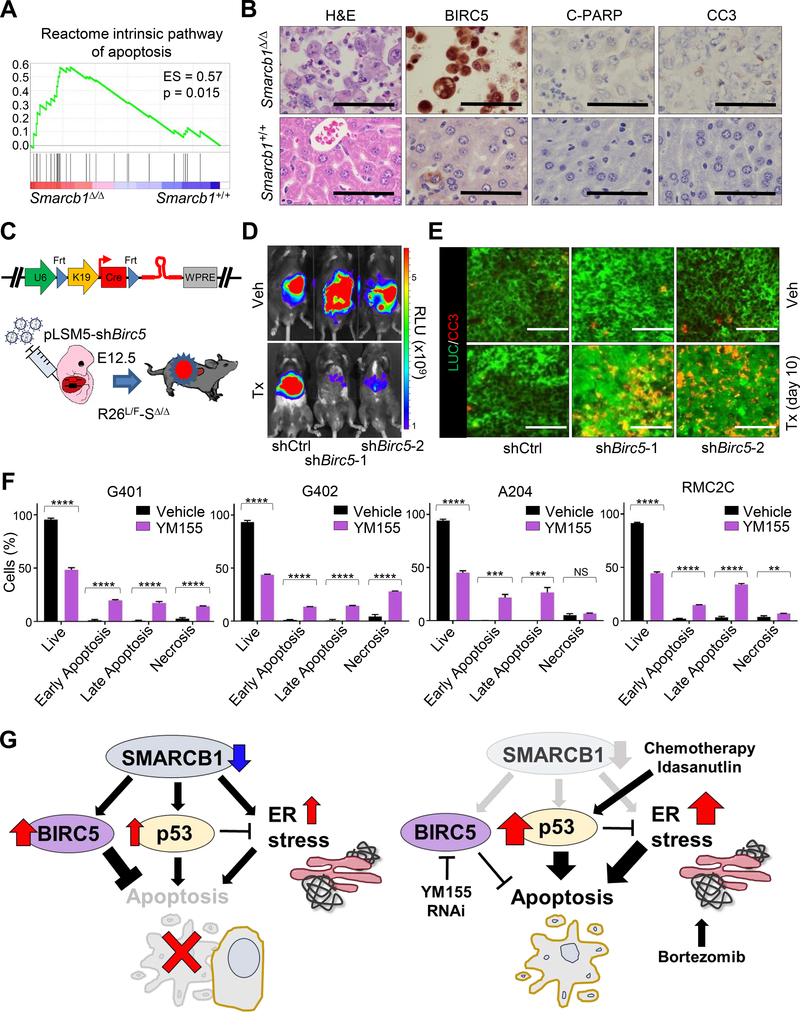
Figure 7. Increased apoptotic threshold through BIRC5 mediates control of effector caspases in MRT.
A) GSEA analysis for enrichrment of the apoptotic program in murine Smarcb1-ablated MRT versus age-matched LacZ controls (n = 5/group). B) Immunohistochemical analysis of markers of apoptosis in Smarcb1-deficient tumors and Smarcb1-proficient controls. C) Schematic model of experimental design to knockdown Birc5 in vivo. A bicistronic lentiviral vector carrying the Cre recombinase under the KRT19 promoter and a latent, Flpo-inducible, shRNA specific for Birc5 or shCtrl vector were introduced in the liver of Rosa26LSL-Luc/FlpoERT2-Smarcb1LoxP/LoxP (R26L/F-SΔ/Δ) E12.5 embryos by trans-uterine injection to generate the R26L/F-SΔ/Δ-pLSM5-shBirc5-1, R26L/F-SΔ/Δ-pLSM5-shBirc5-2 and R26L/F-SΔ/Δ-pLSM5-shCtrl models. Mice were monitored weekly for signs of tumors by palpation and bioluminescence imaging. D) Representative luminescence images displaying the acute effect of the genetic suppression of Birc5 in murine MRT with 2 independent shRNA. shCtrl-transduced mice were used as controls. Images were acquired 3 weeks from the beginning of the treatment and the induction of the shRNAs. E) Representative co-immunofluorescence staining for Luciferase (LUC) (tumor cells) and Cleaved Caspase-3 in Birc5-silenced tumors harvested from experimental cohorts treated with vehicle or tamoxifen for 10 days. F) Quantification by flow cytometry of apoptotic responses (Propidium Iodide/Annexin V) in human-derived MRT (G401, G402 and A204) and RMC (RMC2C) models upon treatment with BIRC5 inhibitor YM155 for 72 hr (n = 3). Data are presented as mean ± the standard deviation of technical replicates. G) Schematic showing the interplay between BIRC5, p53 and ER stress in balancing cell survival and cell death in SMARCB1-deficient tumors. ** p < 0.01, *** p < 0.001, **** p < 0.0001, NS = not significant by unpaired two-tailed-t-test (F). Size bars: 100 μm unless otherwise specified in panel. See also Figure S7.

