Figure 2.

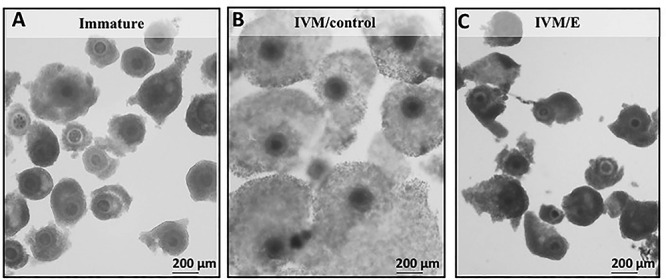
Representative micrographs showing the morphology of COCs after echinomycin treatment. (A) immature COCs, (B) COCs following control IVM (IVM/control), (C) COCs treated with echinomycin (5 nM) during IVM (IVM/E).

Representative micrographs showing the morphology of COCs after echinomycin treatment. (A) immature COCs, (B) COCs following control IVM (IVM/control), (C) COCs treated with echinomycin (5 nM) during IVM (IVM/E).