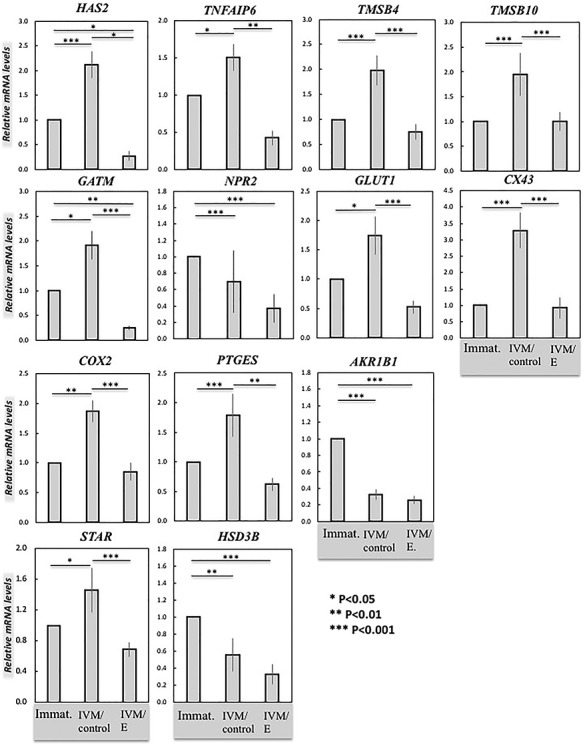
Figure 3.

Effects of functional HIF1alpha suppression on target gene expression in cumulus cells derived from COCs as evaluated by semi-quantitative (TaqMan) real time PCR. Three experimental groups were involved: immature COCs (Immat.), control in vitro matured COCs (IVM/control), and COCs treated with echinomycin (5 nM) during IVM (IVM/E). The effect of functional HIF1alpha suppression on gene expression of target genes in cumulus cells was tested by one-way ANOVA, revealing: HAS2 (P < 0.0001), TNFAIP6 (P < 0.0001), TMSB4 (P = 0.0001), TMSB10 (P = 0.005), GATM (P < 0.0001), NPR2 (P = 0.036), GLUT1 (P = 0.0008), CX43 (P = 0.0001), COX2 (P = 0.001), PTGES (P < 0.0001), AKR1B1 (PGFS/20αHSD) (P < 0.0001), STAR (P = 0.0001), and HSD3B (P < 0.0001). Tukey–Kramer multiple comparisons post-test was applied to test the effect of treatment on gene expression (solid lines). Bars with asterisks differ at: *P < 0.05, **P < 0.01, ***P < 0.001, as indicated on the figure. Results are presented as mean ± SEM.
