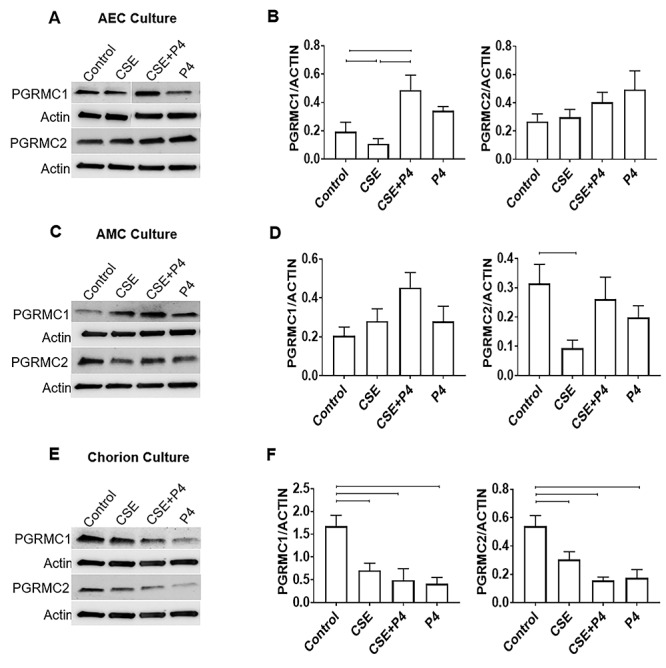
Figure 3.

Effect of P4 on PGRMC expression in fetal membrane cells. Data represented in bar graphs are mean ± SEM. (A and B) Densitometry showed P4 co-treatment significantly increased PGRMC1 (P = 0.01) expression in AECs compared with CSE and control cells, whereas CSE alone significantly decreased PGRMC1 (P = 0.054) (N = 5). (C and D) Densitometry showed CSE treatment significantly decreased PGRMC2 expression (P = 0.01) in AMCs, whereas P4 co-treatment was able to increase both PGRMC1 and PGRMC2 compared with CSE alone (N = 5). (E and F) Densitometry showed CSE treatment significantly inhibited PGRMC1 (P = 0.006) and PGRMC2 (P = 0.03) expression, which was not recovered with co-treatment with P4 (PGRMC1: P = 0.007 and PGRMC2: P = 0.004). P4 alone also significantly reduced PGRMC1 (P = 0.007) and PGRMC2 (P = 0.004) expression (N = 5).
