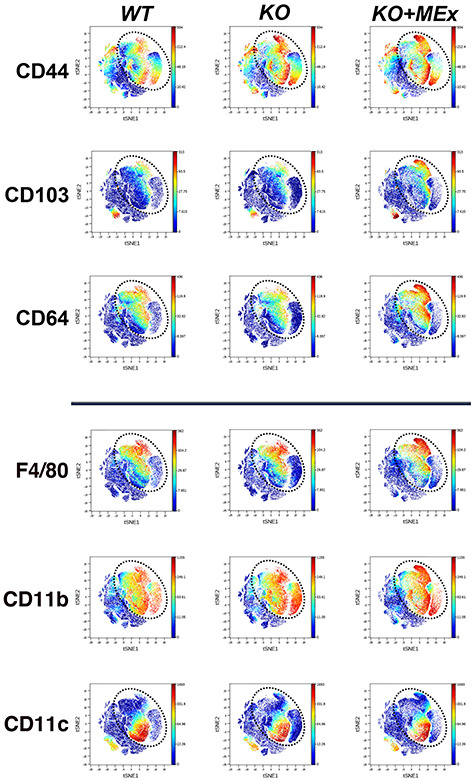
Figure 5.

Antenatal MEx therapy confers phenotypic shifts among intrauterine myeloid populations. CyTOF analysis of GD12 utero-placental leukocytes. tSNE plots representative of four independent experiments, three pregnant dams/experiment. Dotted circle indicates area of prominent tSNE plot shifts between experimental groups. Multicolor scale indicates signal intensity for each surface marker.
