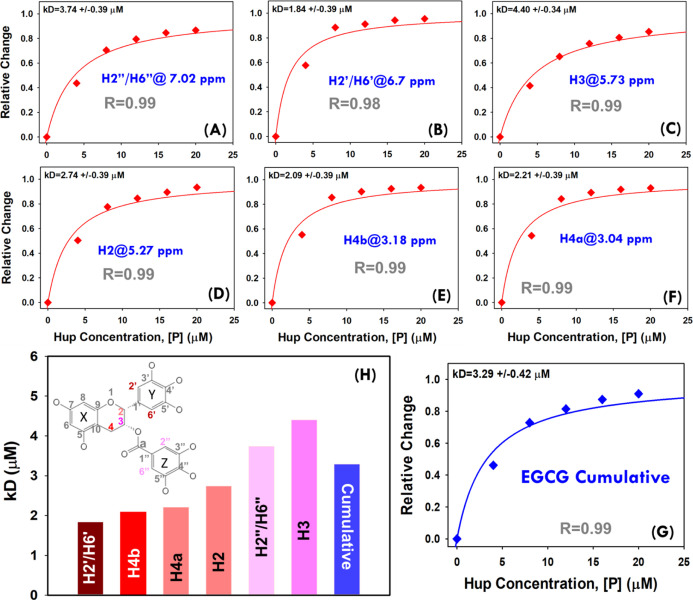
Figure 10.
(A–F) Hyperbolic (saturation binding) curves showing a relative change in NMR signals of EGCG resonances (θ = I0 – I/I0) as a function of protein concentration (0.0, 4.0, 8.0, 12.0, 16.0, and 20.0 μM). The dissociation constants (kD values) based on individual EGCG peaks were estimated by fitting each individual saturation binding curve to hyperbolic eq 2 (shown in main paper). (G) The cumulative saturation binding curve for interaction between EGCG and Hup and its fitting to hyperbolic eq 2 are used to estimate the apparent dissociation constant (kD). (H) Bar plot showing a progressively increasing dissociation constant for different EGCG signals and the cumulative value derived from the average change of signal intensity. The 2D molecular structure of EGCG highlighted for protons showing relevant hyperbolic saturation binding curves as per the colors of their respective bars in the graph (H).

