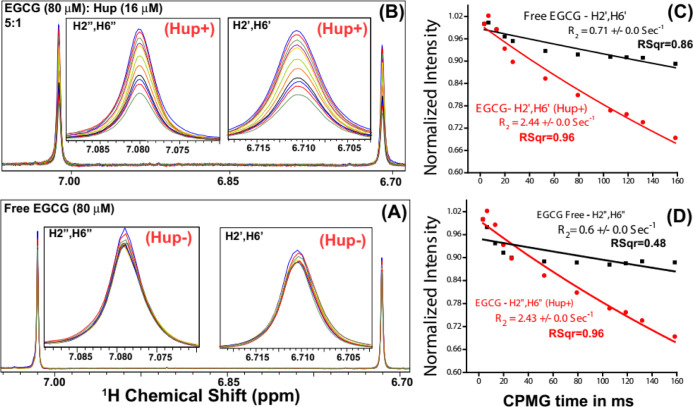
Figure 11.
(A,B) Intensity profiling of two major EGCG NMR signals: one at δ (6.71 ppm) corresponding to EGCG resonances H2′/H6 second at δ (7.08 ppm) corresponding to EGCG resonances H2″/H6″. Compared to NMR signals of free EGCG (A), the signal attenuation (i.e. decreasing signals with increasing CPMG time) is relatively more in the presence of Hup (A) clearly indicating the binding interaction between GrA and Hup. (C,D) Apparent 1H transverse relaxation (T2) times of EGCG resonances (H2′/H6 and H2″/H6″) compared in the absence (black) and presence of protein Hup (red) (for protein to ligand ratio ∼16:∼80 μM = 1:5).

