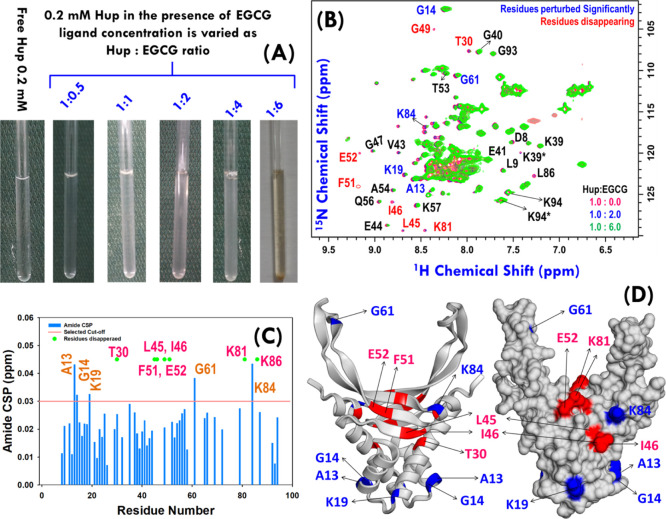
Figure 8.
(A) Uniformly 15N-labeled Hup sample (concentration ∼ 0.2 mM) titrated with EGCG stock solution of concentration 20.0 mM. (B) Overlay of 1H–15N SOFAST-heteronuclear multiple quantum correlation (HMQC) spectra of free Hup protein (red) and Hup containing EGCG: blue and green spectra represent the protein to ligand ratio equal to 1:2 and 1:6, respectively. The residues showing significant CSP from the free Hup protein are highlighted with blue color labels, and those exhibiting significant loss of the amide cross-peak signal are highlighted with red color labels. (C) CSP map depicting the change in the chemical shift values for 49 ambiguous cross-peaks of the Hup protein. The solid radish pink line represents the cutoff CSP value (∼0.03 ppm). (D) Homodimeric structure of the H. pylori Hup protein (left: ribbon diagram and right: surface structure); the perturbed and disappearing residues are shown in blue and red colors. Note the residues labeled in the black text are shown to highlight the assignment of some of the residues, where asterisk symbol “*” represents the peak corresponding to an alternative conformation. “Photograph courtesy of “Ritu Raj”. Copyright 2020.”

