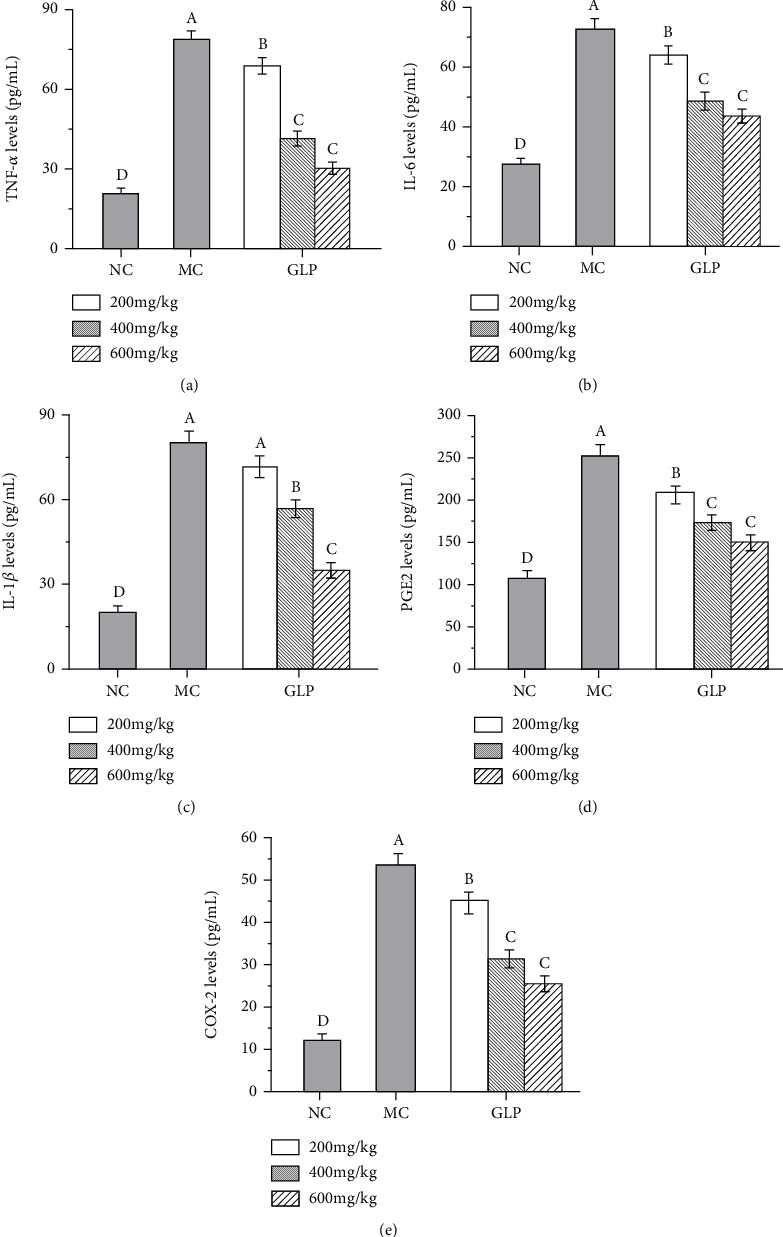
Figure 3.

Effects of GLP on the levels of TNF-α (a), IL-6 (b), IL-1β (c), PGE2 (d), and COX-2 (e). The values were reported as the mean ± S.D. (n = 10 for each group). Significant differences between the experimental groups were determined by the one-way ANOVA followed by the Tukey Analysis. The bars with different letters are significantly different. COX-2: cyclooxygenase-2; GLP: G. lucidum polysaccharides; IL-1β: interleukin-1β; IL-6: interleukin-6; MC: model control; NC: normal control; PGE2: phenyl glycidyl ether 2; TNF-α: tumor necrosis factor-α.
