Figure 5.

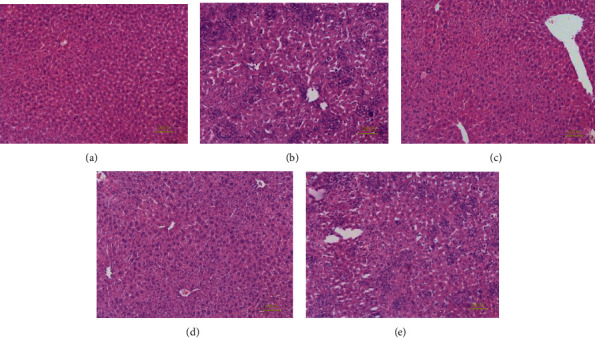
Optical micrographs of mouse liver sections by HE staining (200x magnification). (a) NC group, (b) MC group, (c) GLP at 600 mg/kg, (d) 400 mg/kg, and (e) 200 mg/kg. GLP: G. lucidum polysaccharides; MC: model control; NC: normal control.

Optical micrographs of mouse liver sections by HE staining (200x magnification). (a) NC group, (b) MC group, (c) GLP at 600 mg/kg, (d) 400 mg/kg, and (e) 200 mg/kg. GLP: G. lucidum polysaccharides; MC: model control; NC: normal control.