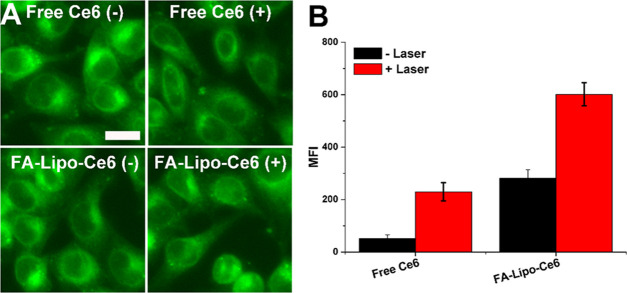
Figure 3.
ROS generation capacity of FA-Lipo-Ce6. (A) Confocal laser scanning scope (CLSM) images of cells treated by free Ce6 or FA-Lipo-Ce6 with/without irradiation (1 W/cm2, 5 min). The scale bar is 20 μm. (B) MFI of ROS in cells determined by flow cytometry. The results were expressed as the mean ± SD of three independent experiments.

