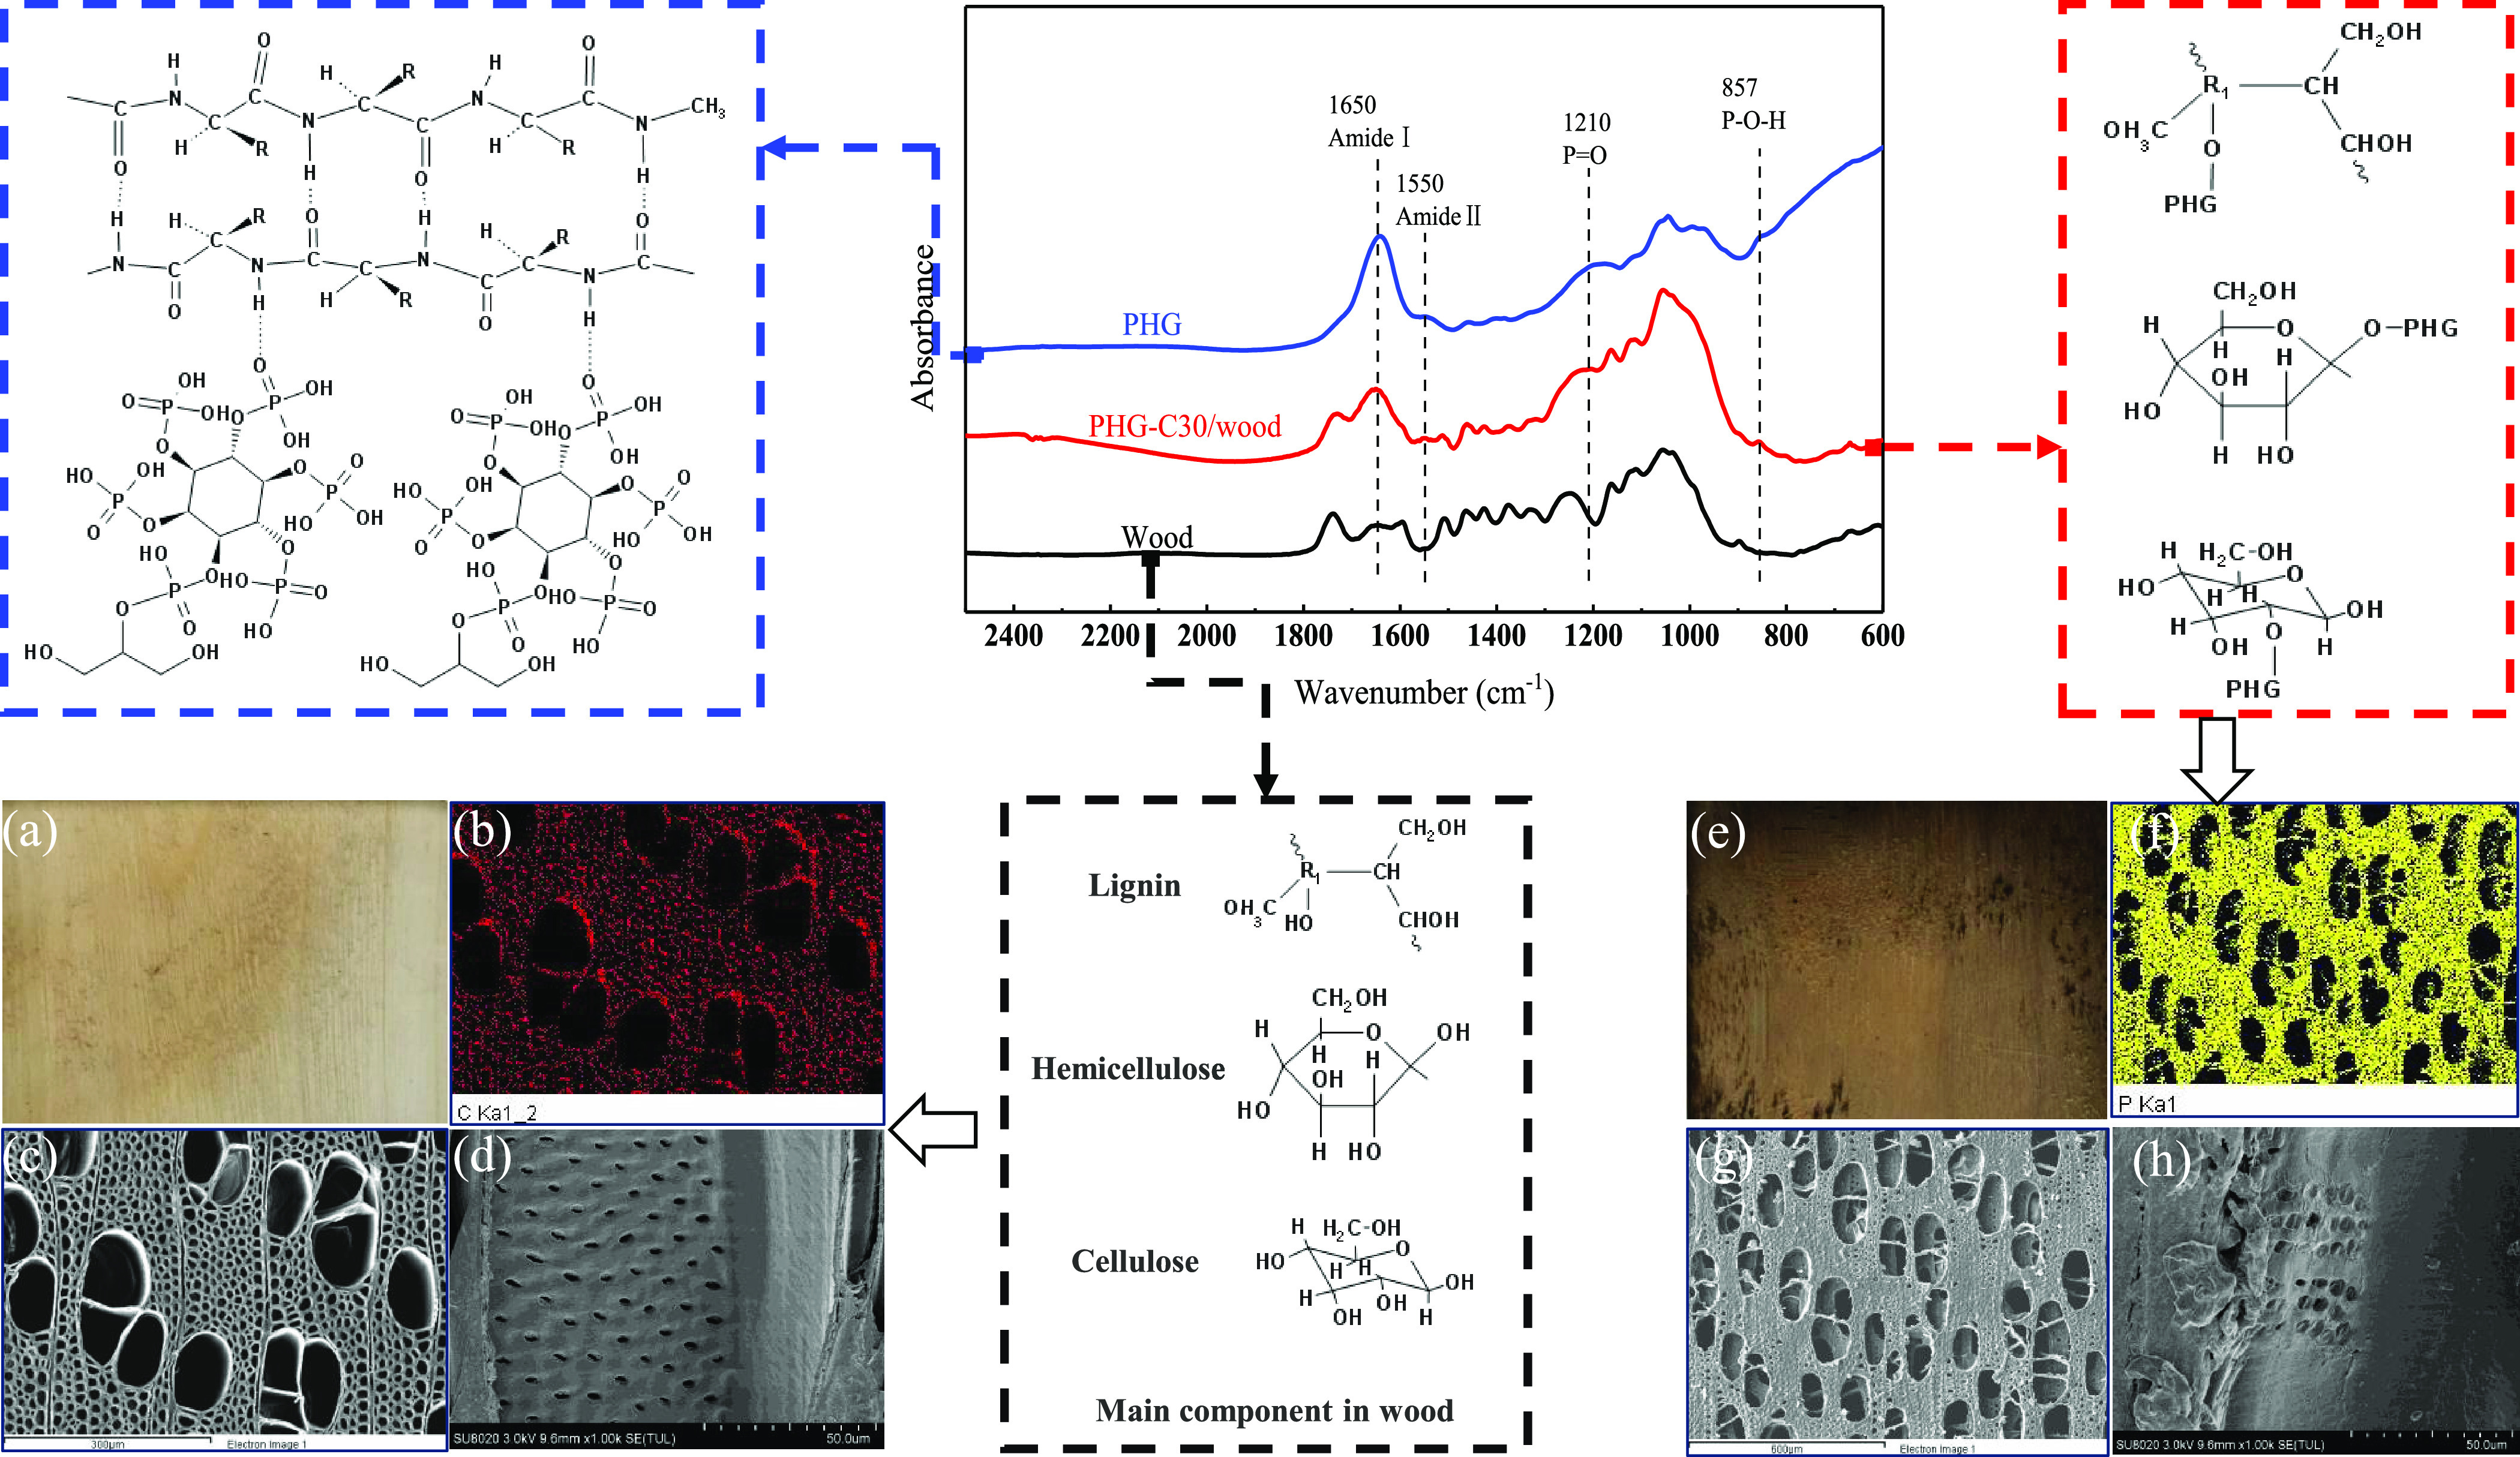
Figure 1.

Infrared spectrum of pure (untreated) wood, PHG, and PHG-C30/wood and their morphologies and elemental mapping: (a) digital image of pure wood and (e) PHG-C30/wood; (b) EDX spectra of pure wood showing an abundance of C and (f) PHG-C30/wood showing the presence of P due to the impregnation of the PHG-C30 solution; (c) SEM image of a cross section in pure wood (300-μm scale) and (d) wood vessels in a longitudinal section (50-μm scale) showing smooth and clean pits; (g, h) SEM images of a cross section in PHG-C30/wood (600 μm scale) and wood vessels in a longitudinal section (50 μm scale) showing fillers and membranous substances.
