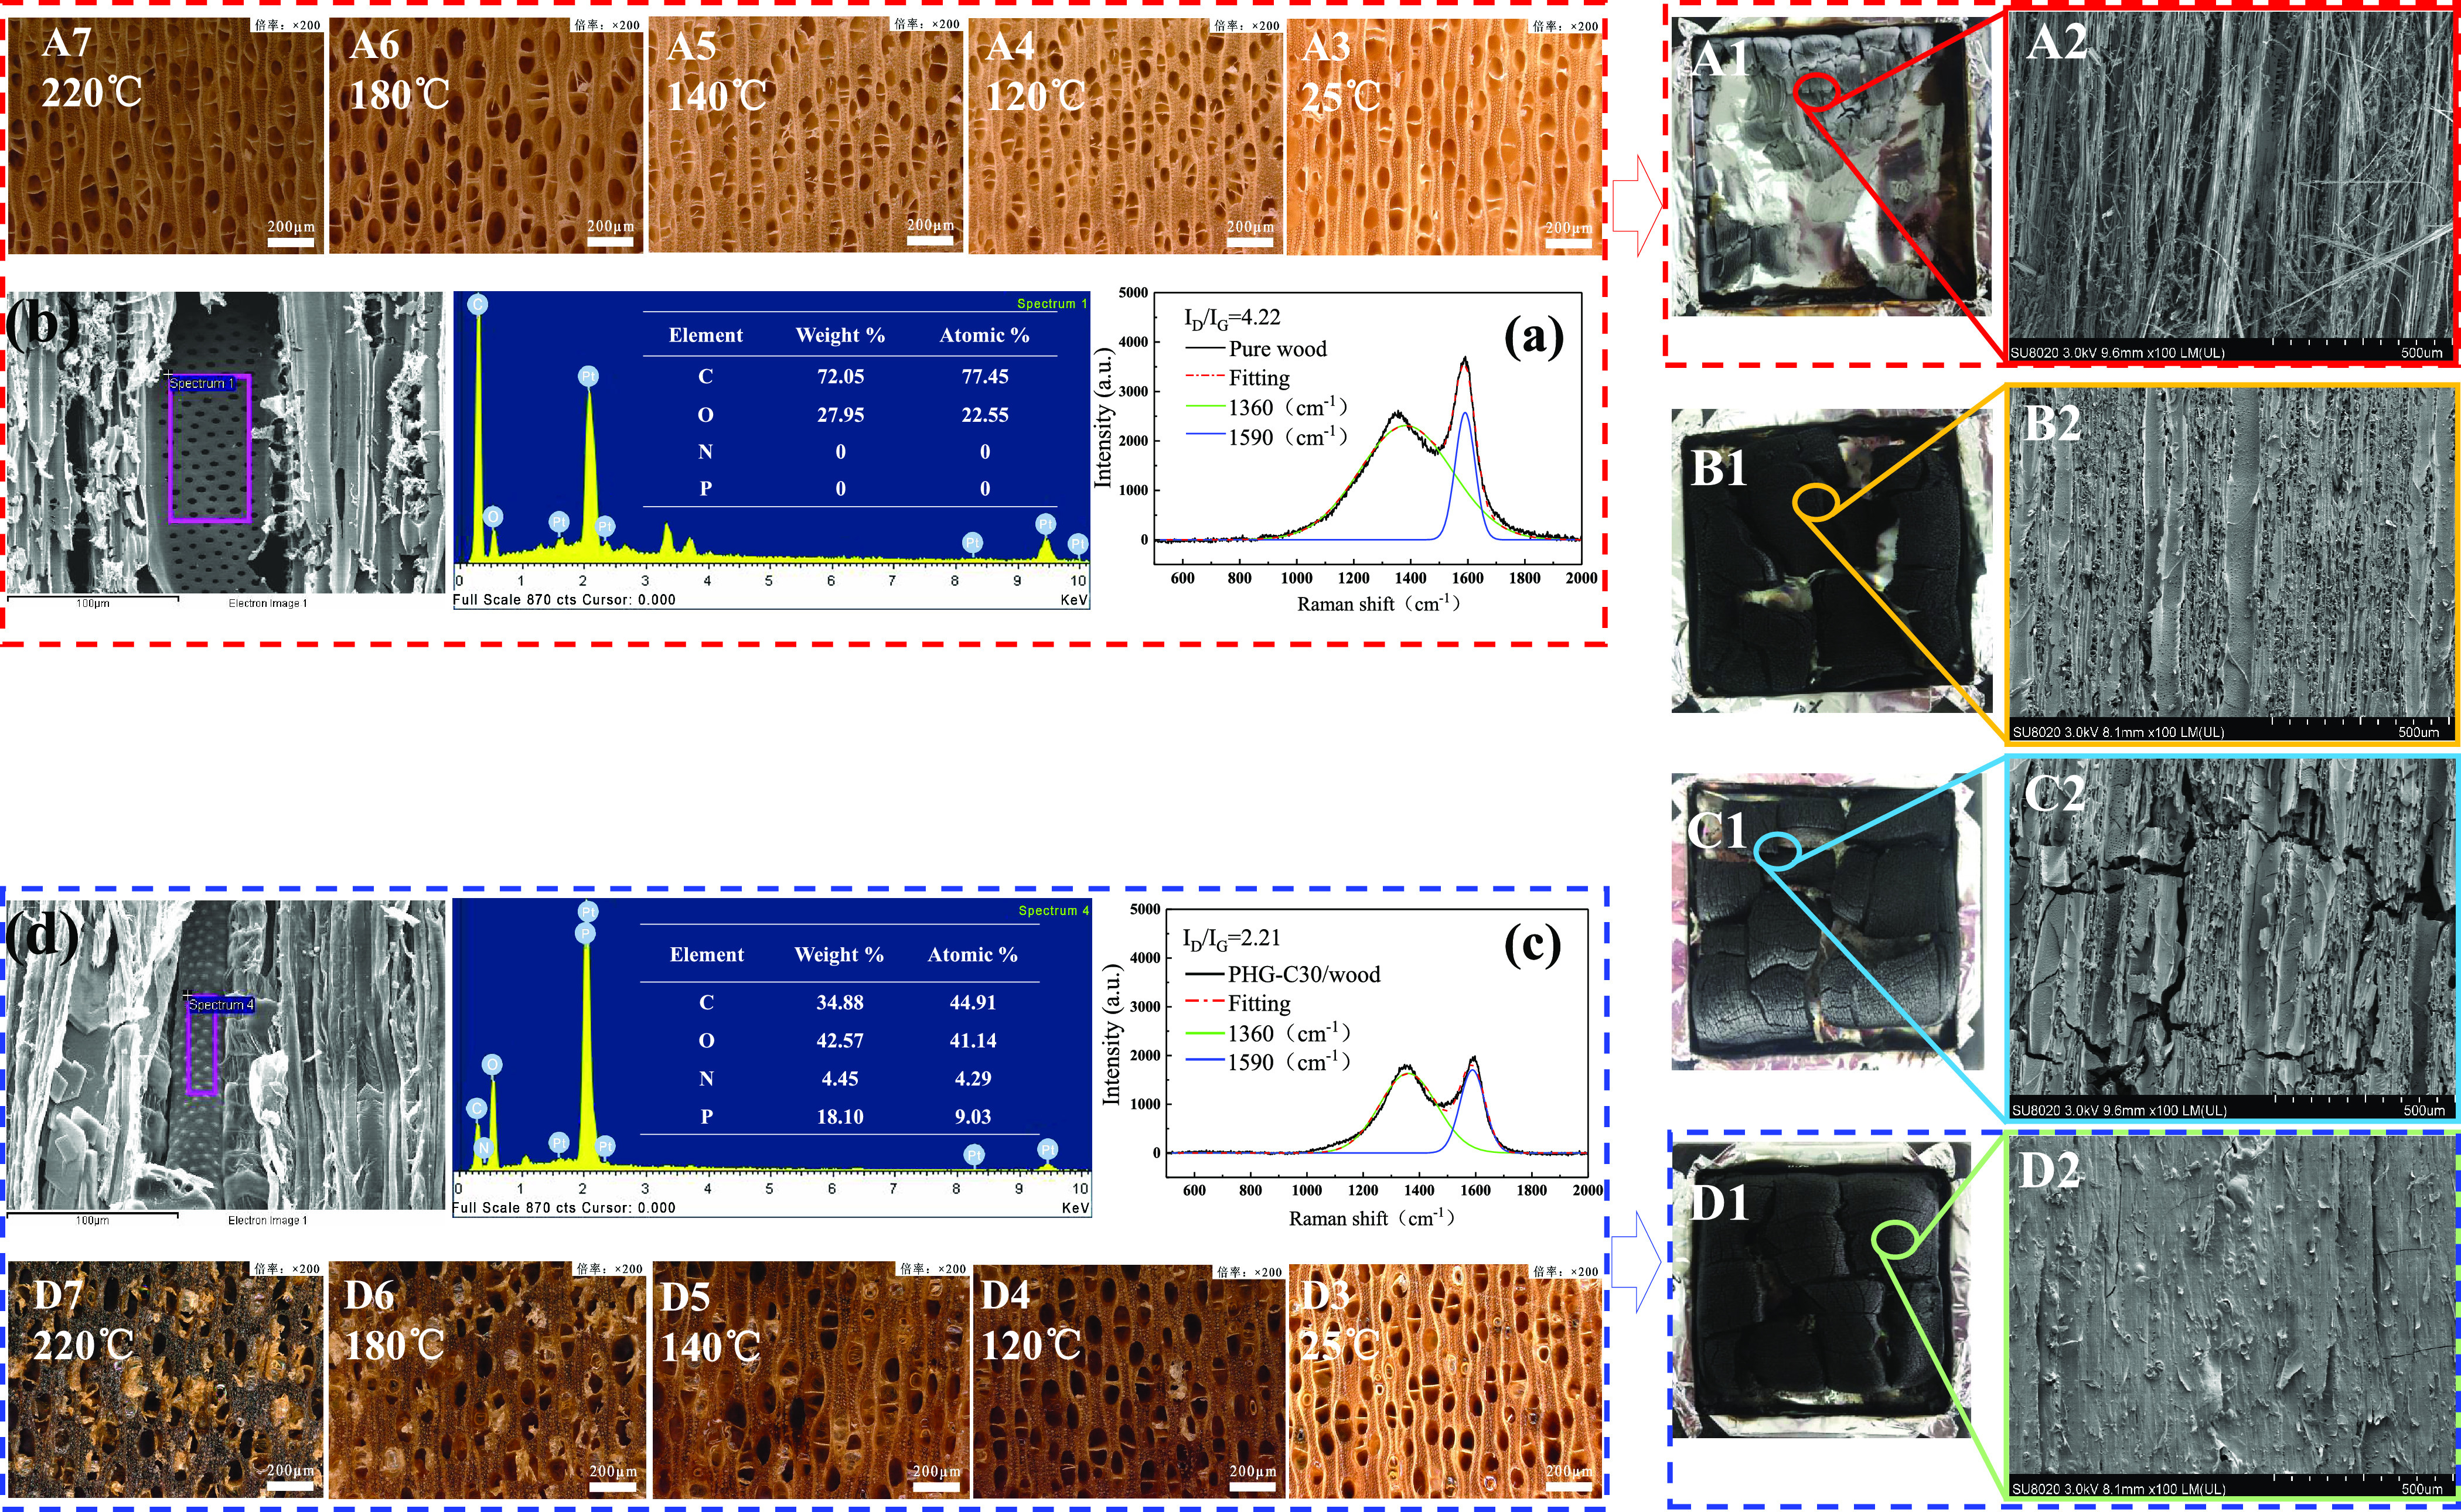
Figure 5.

Char residues after the CONE tests (A1: pure wood, B1: PHG-C10/wood, C1: PHG-C20/wood, and D1: PHG-C30/wood) and corresponding SEM micrographs (500 μm scale; A2, B2, C2, and D2) showing an increasing proportion of C residue. (a) Pure wood and (c) PHG-C30/wood C residue Raman peak fitting curves indicating that the char of PHG-C30/wood had a higher degree of graphitization. (b) Pure wood and (d) PHG-C30 /wood C residue EDX spectrometry showing that the char of PHG-C30/wood had a high P content; (A3–A7) morphological changes in the pure wood and (D3–D7) PHG-C30/wood at different temperatures (25, 120, 140, 180, and 220 °C), where PHG-C30/wood shows a notable foaming/expansion effect.
