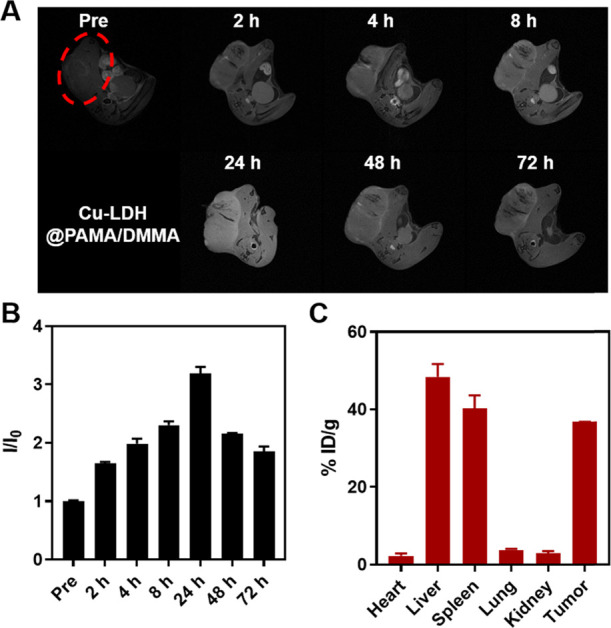
Figure 5.

Tumor accumulation of Cu-LDH@PAMA/DMMA. (A) In vivoT1-weighed MR images of B16F0 tumor-bearing mice in a time-course before and after intravenous injection of Cu-LDH@PAMA/DMMA within 72 h. (B) Corresponding relative signal intensity in tumors. I0 and I: MRI signal intensity of the tumors before injection and at a specific time point postinjection, respectively. (C) Cu amount in the heart, liver, spleen, lung, kidney, and tumor dissected from mice at 24 h postinjection, determined by inductively coupled plasma-optical emission spectrometry (ICP-MS).
