
Figure 2.
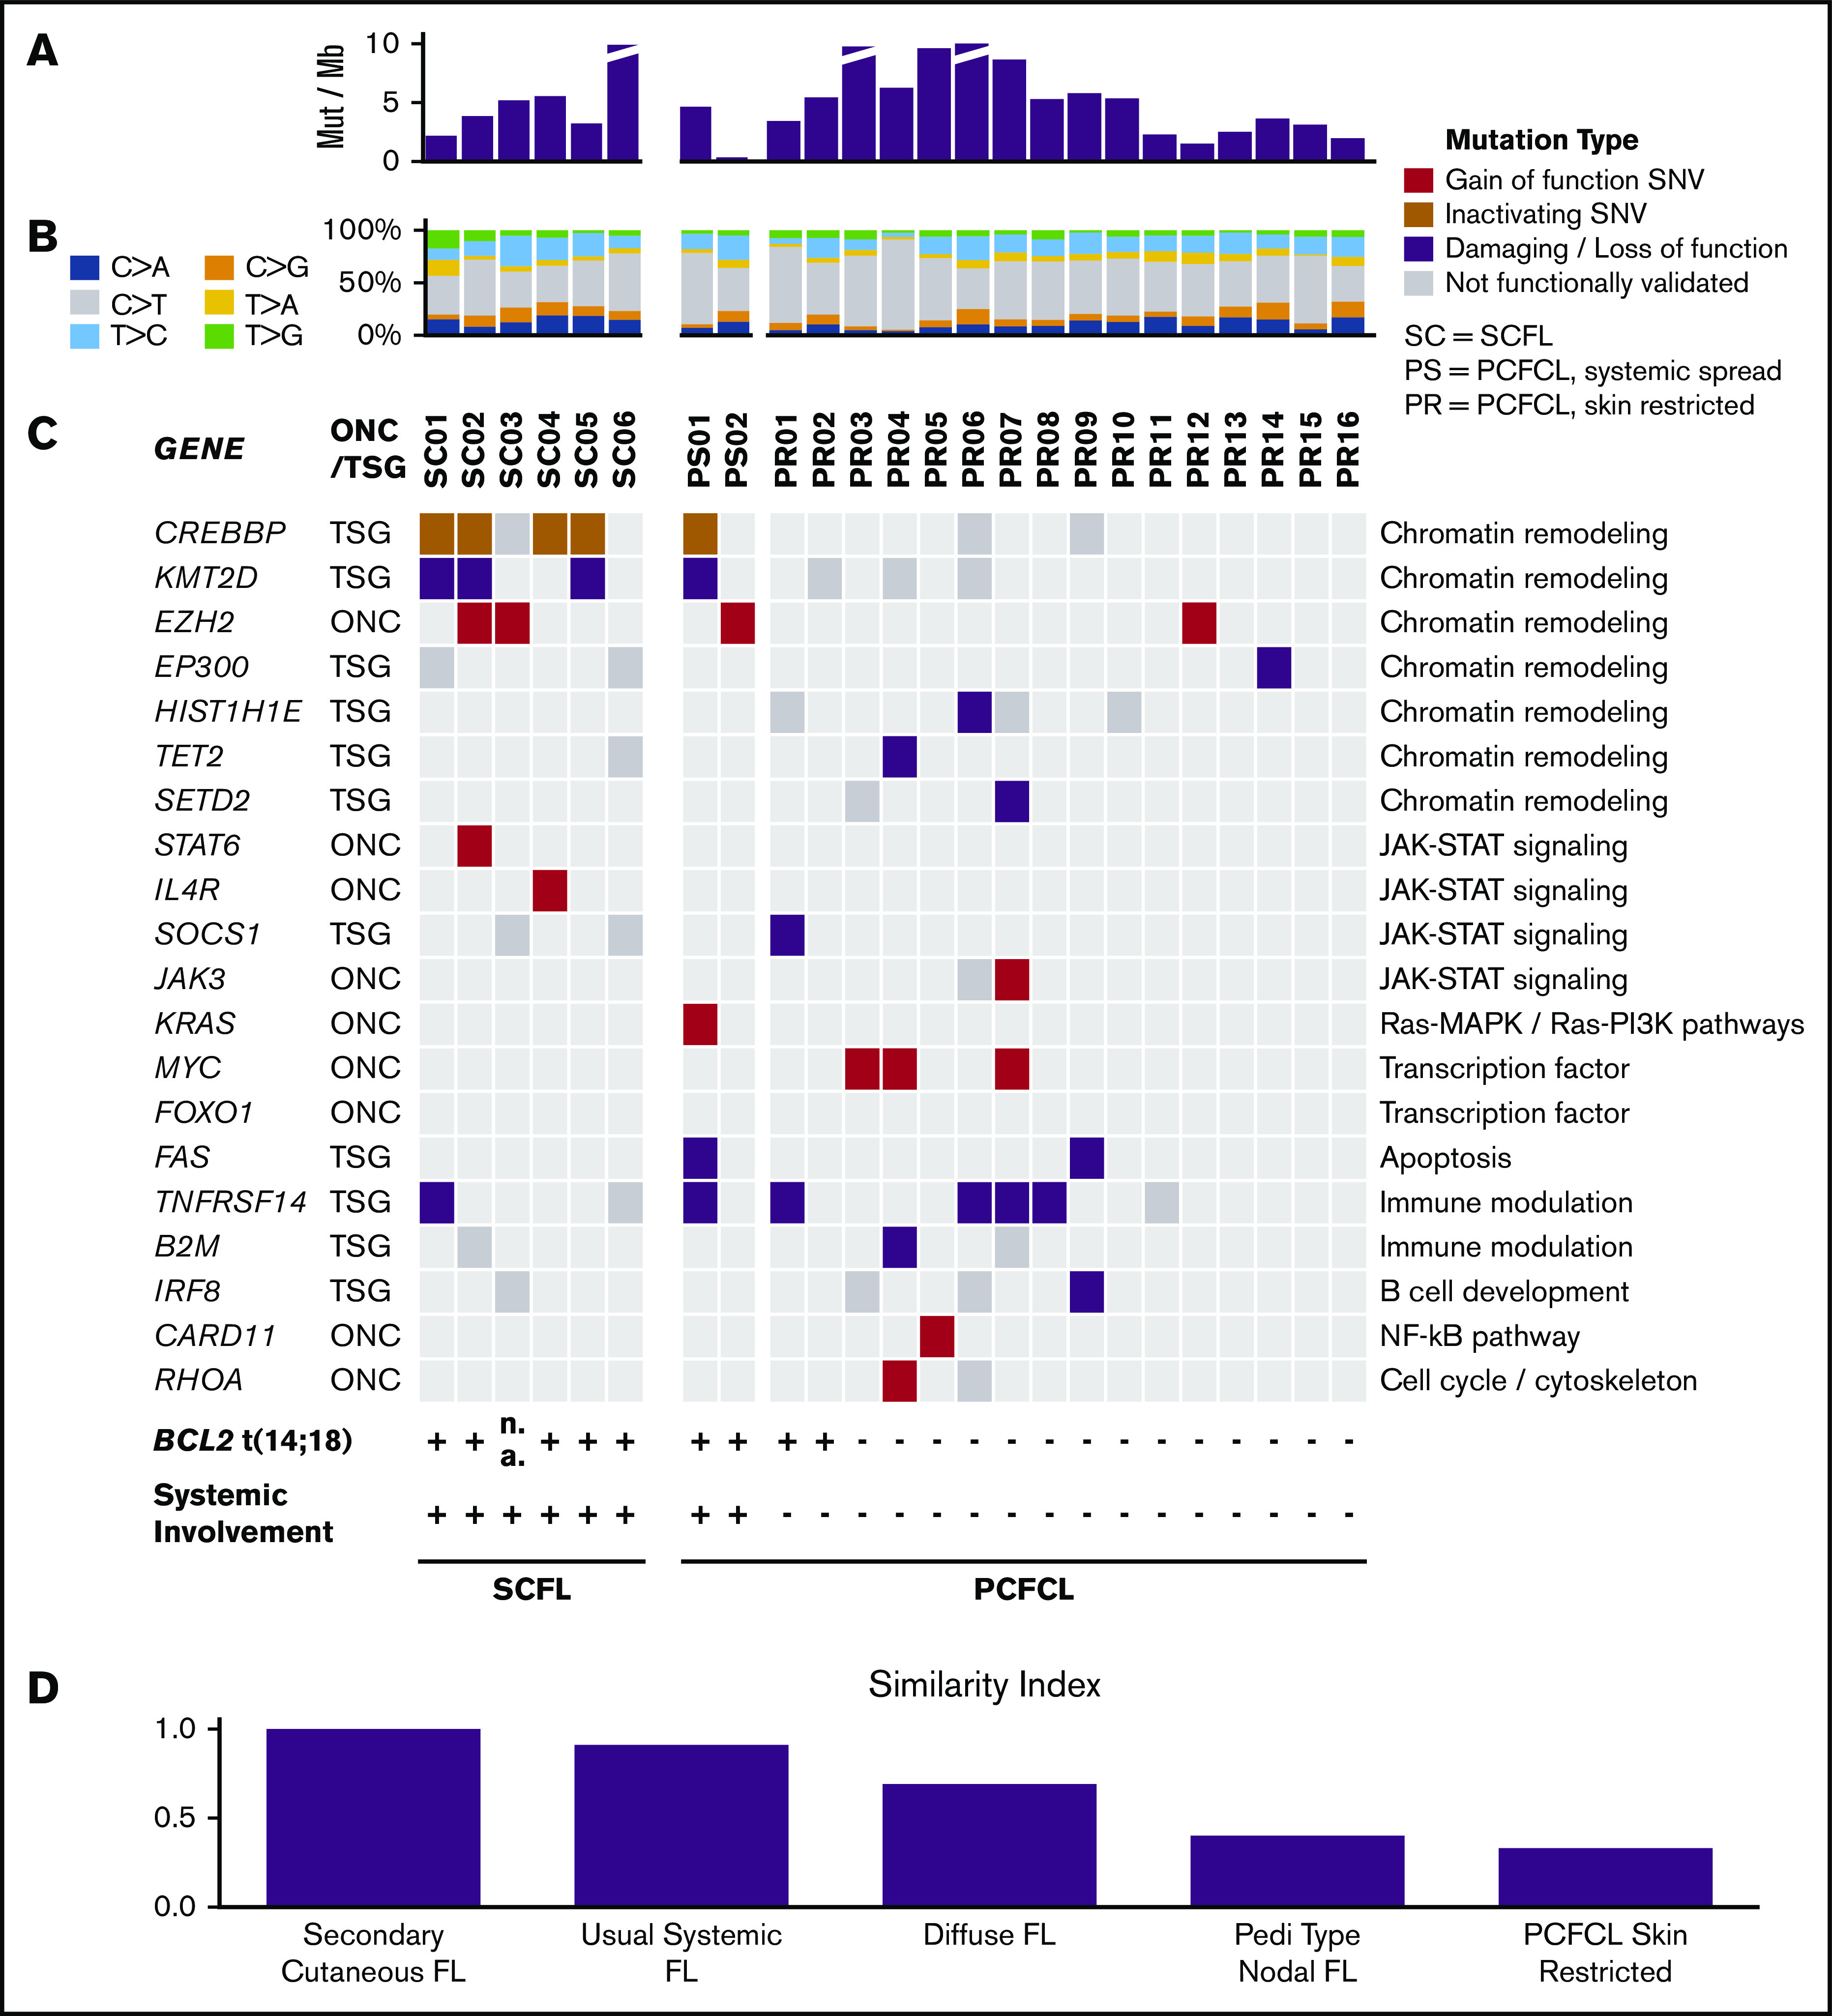
Landscape of somatic alterations in PCFCL and SCFL. (A) The number of somatic mutations per megabase in each specimen. (B) The relative ratios of single somatic nucleotide variant (SNV) types in each specimen. (C) Oncoplot. Red denotes gain of function mutations in putative oncogenes; brown or purple denotes inactivating or damaging mutations in putative tumor-suppressor genes, respectively; gray denotes missense mutations that have not been functionally validated. (D) Similarity index comparison of FL subtypes standardized to SCFL.