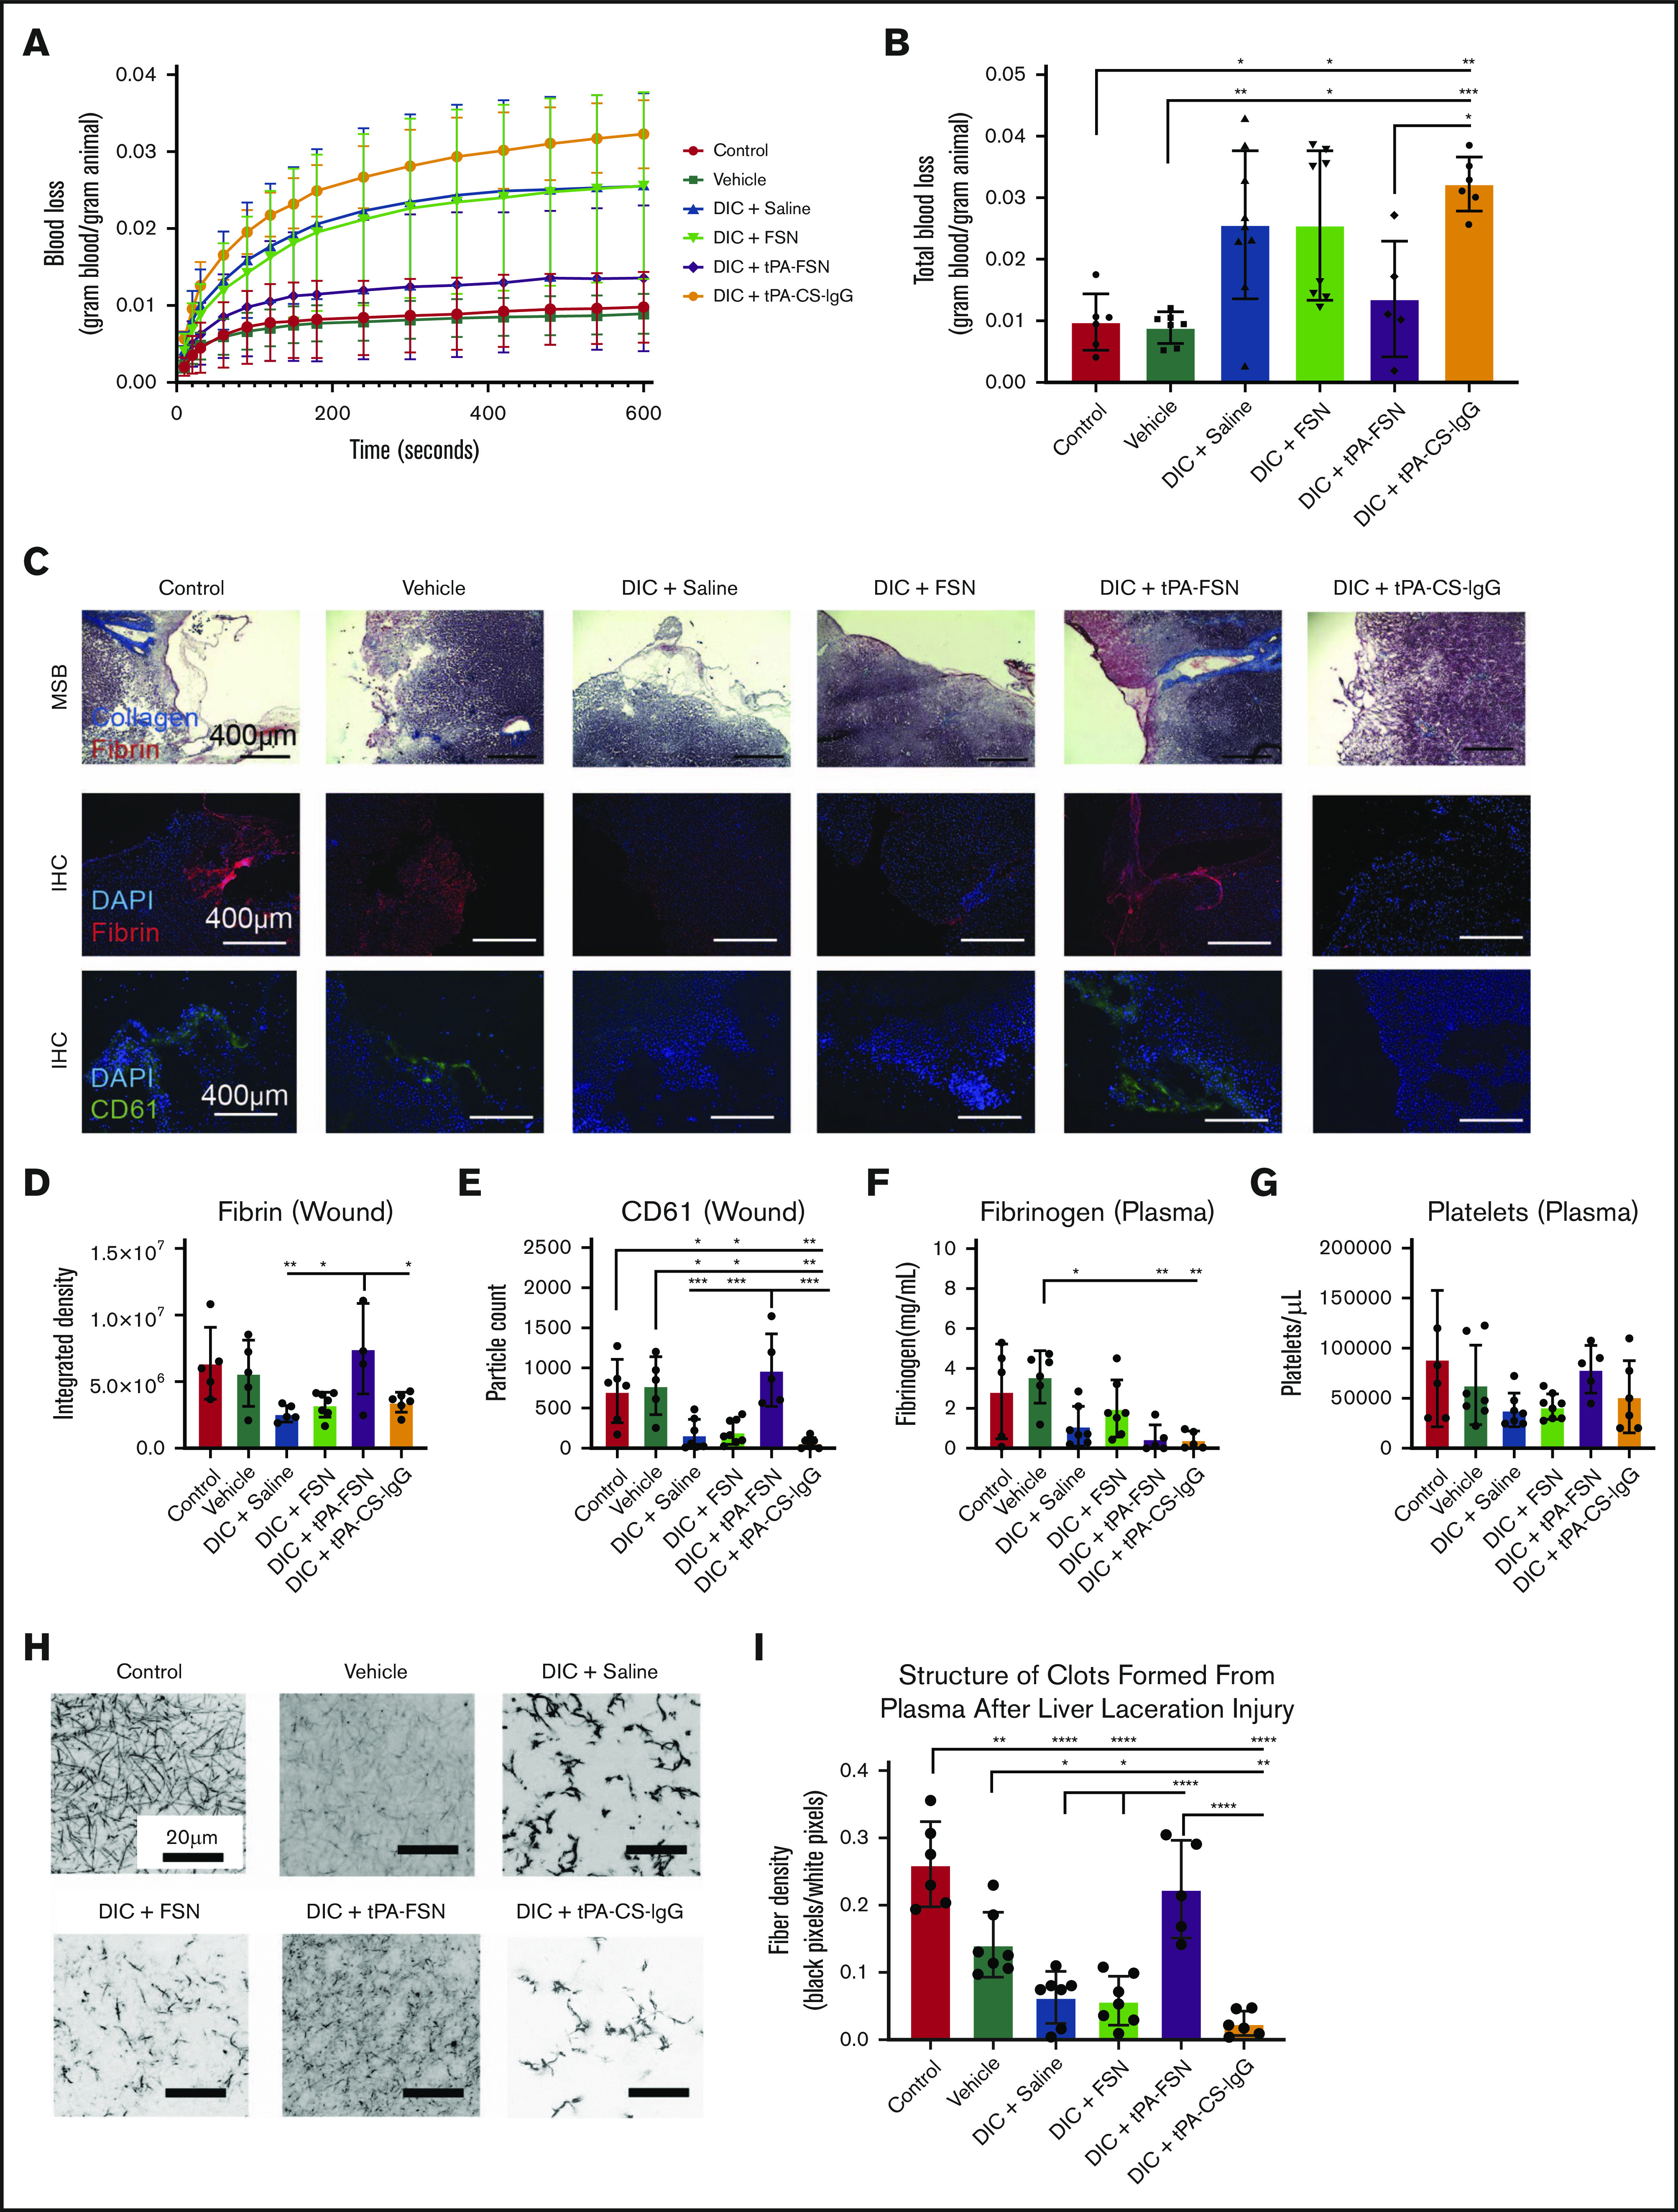
Figure 5.

Evaluation of bleeding in a DIC rodent model with tPA-FSN treatment. Blood loss over time (A) and total blood loss (B) from a liver laceration injury from control (n = 6), vehicle (n = 7), and DIC animals treated with saline (n = 9), FSNs (n = 8), tPA-FSNs (n = 5), or tPA-CS-IgG (n = 6). (C) Representative histology images from wound tissue sections from each treatment group, including MSB-stained wound sections, IHC for fibrin at the wound site, and IHC for CD61 at the wound site. Images were taken on an EVOS FL Auto Imaging System at 10× magnification. Corresponding quantification was conducted with ImageJ particle analysis software. (D-E) IHC quantification at the wound sites for fibrin (D) (control, n = 5; vehicle, n = 5; DIC + saline, n = 5; DIC + FSN, n = 7; DIC + tPA-FSN, n = 5; DIC + tPA-CS-IgG, n = 6) and platelet CD61 (E) (control, n = 6; vehicle, n = 5; DIC + saline, n = 7; DIC + FSN, n = 8; DIC + tPA-FSN, n = 5; DIC + tPA-CS-IgG, n = 6). Blood samples from control, vehicle, and all DIC groups were used to determine fibrinogen levels (F) (control, n = 5; vehicle, n = 6; DIC + saline, n = 7; DIC + FSN, n = 7; DIC + tPA-FSN, n = 5; DIC + tPA-CS-IgG, n = 5) and platelet count (G) (control, n = 6; vehicle, n = 7; DIC + saline, n = 7; DIC + FSN, n = 8; DIC + tPA-FSN, n = 5; DIC + tPA-CS-IgG, n = 6). (H) Confocal microscopy was used to photograph clot formation for all treatment groups. (I) Corresponding quantification of fiber density (control, n = 6; vehicle, n = 7; DIC + saline, n = 7; DIC + FSN, n = 7; DIC + tPA-FSN, n = 5; DIC + tPA-CS-IgG, n = 6) with an average of 3 images per animal. A Zeiss LSM 710 Laser Scanning Microscope was used for confocal images. A C-Apochromat 63× 1.2W objective lens was used to capture 1.89-μm z-stack images, which were analyzed by using ImageJ to make 8-bit 3D projections. Fiber density was quantified by determining the ratio of black (fiber) over white (background) pixels in each binary image. Data are presented as average ± standard deviation. Data sets were analyzed via 1-way ANOVA with a Tukey’s post hoc test using a 95% confidence interval. *P < .05; **P < .01; ***P < .001; ****P < .0001.
