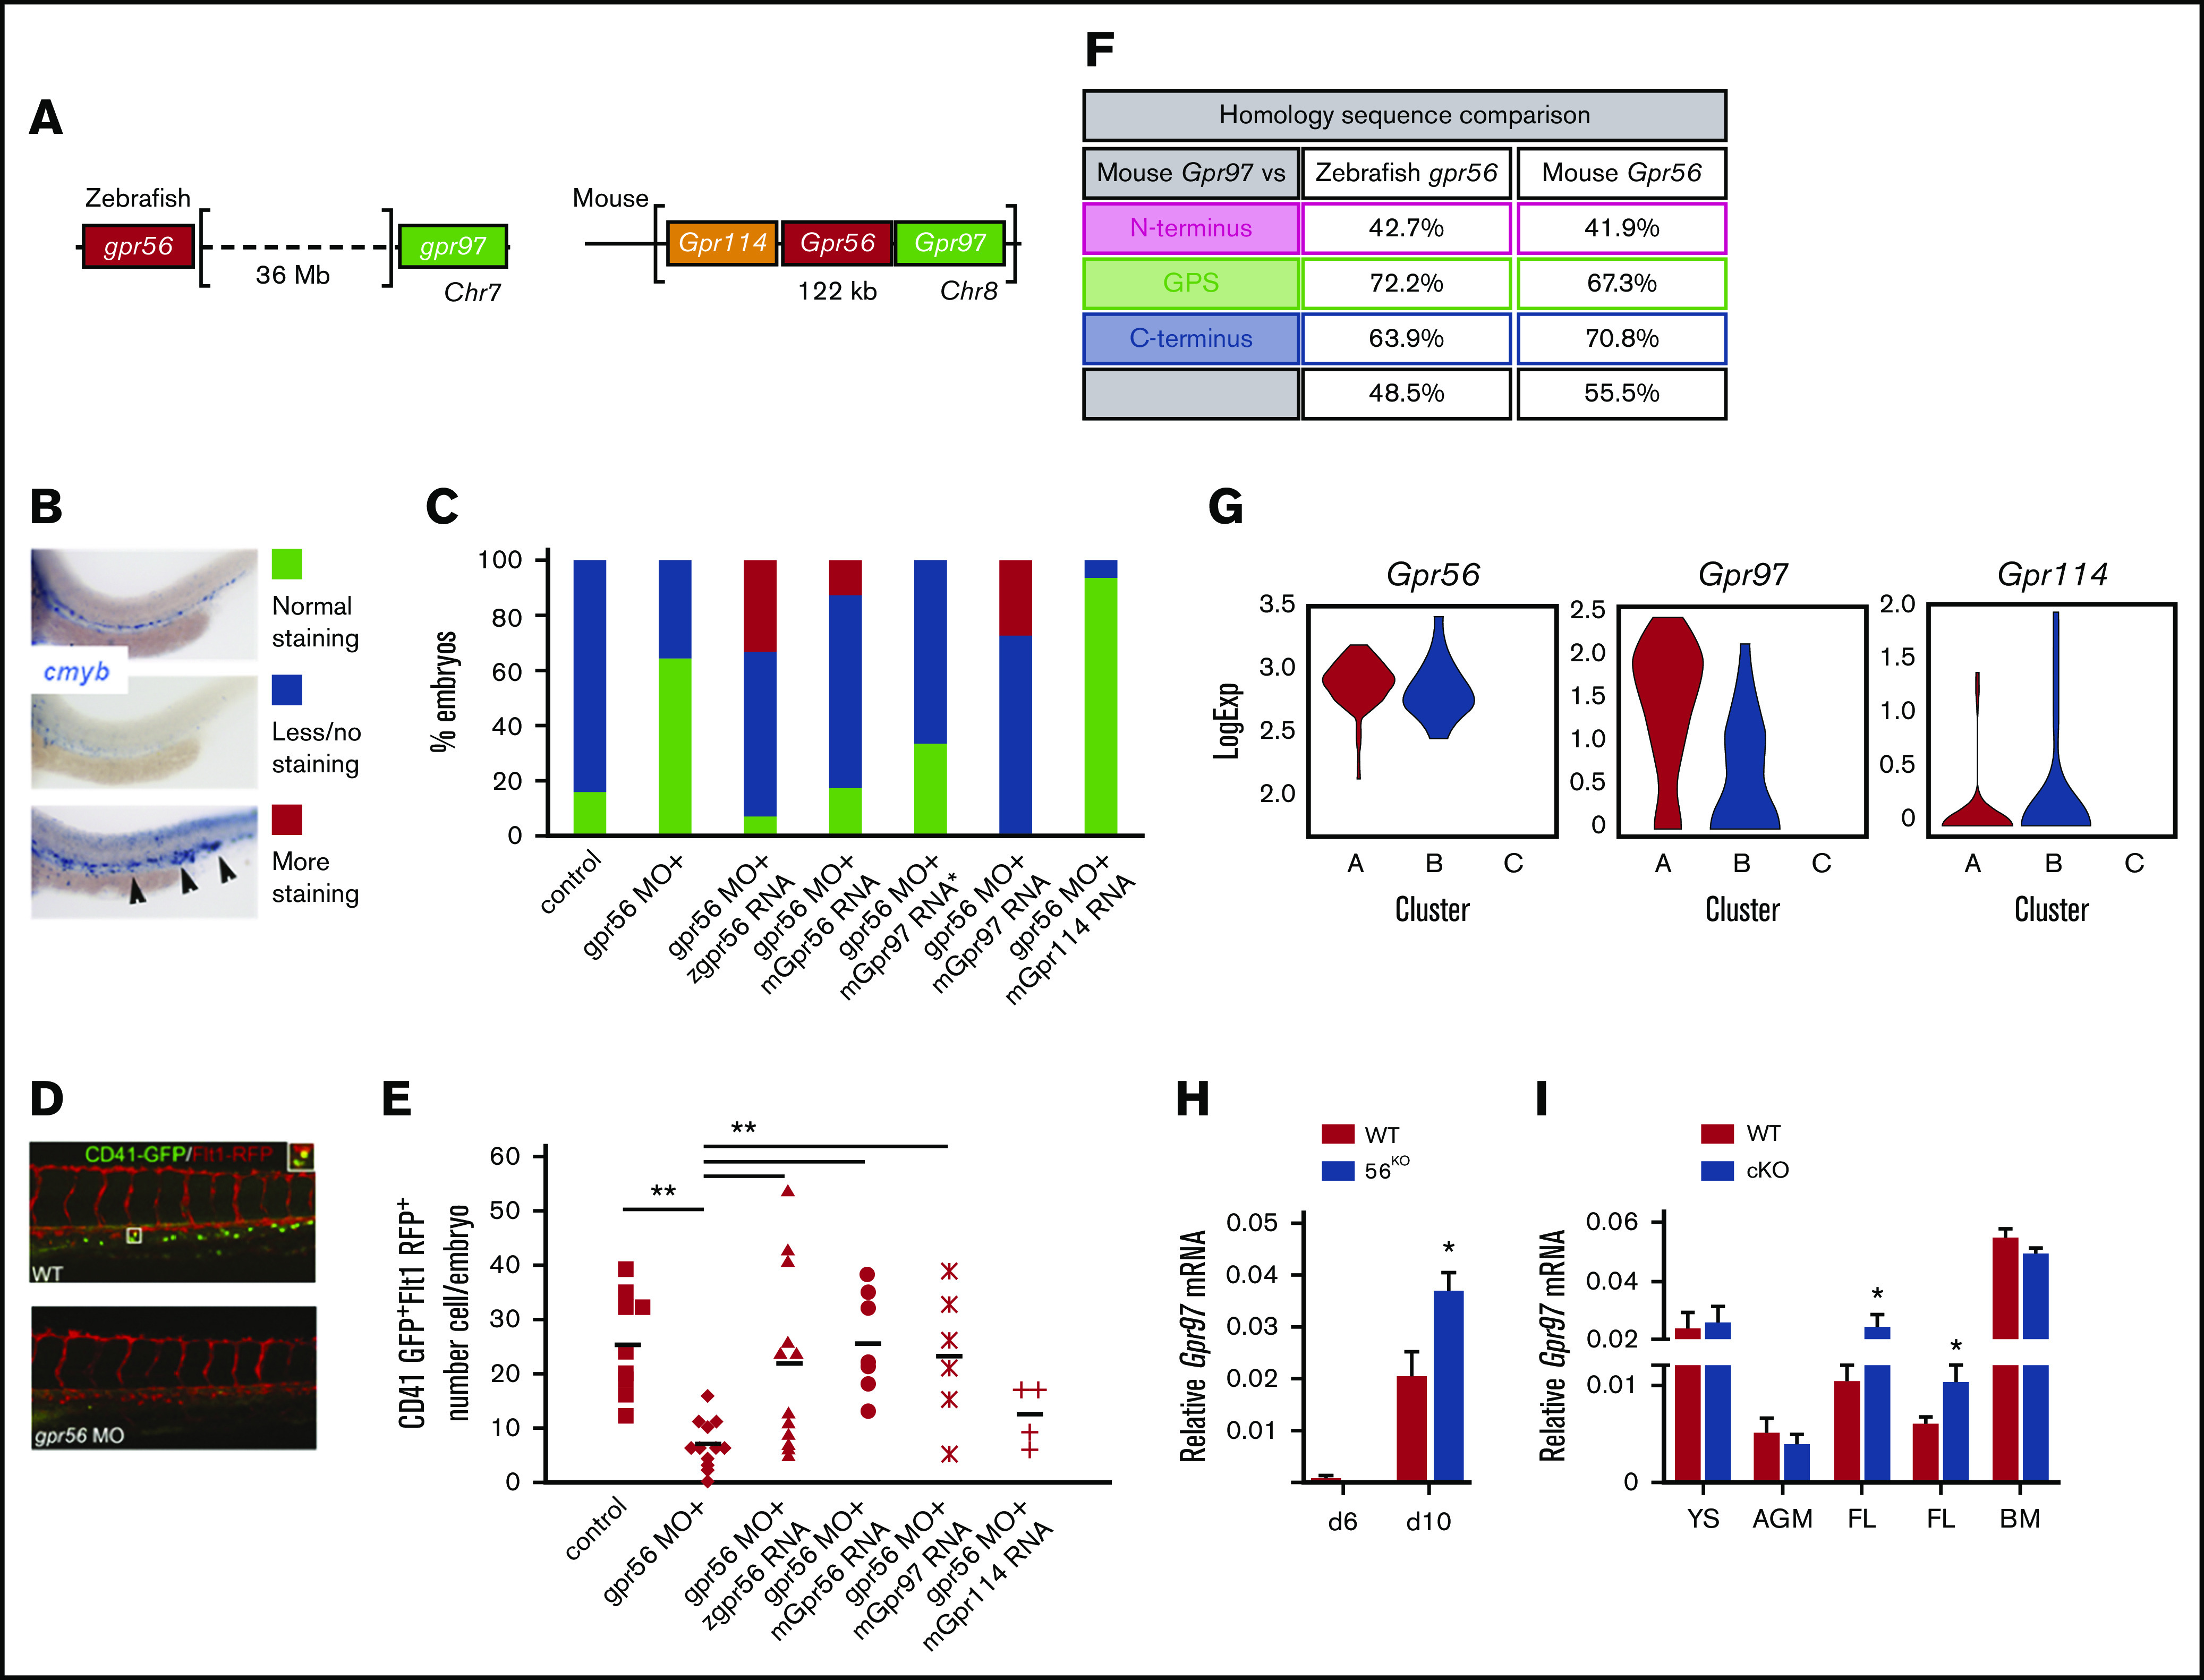
Figure 5.

Redundant function of mouse Gpr97 in Gpr56 morphant zebrafish and Gpr97 expression in mouse ESCs and embryonic tissues. (A) Schematic of the Gpr56 locus in zebrafish and mouse. Two highly homologous genes, Gpr114 and Gpr97, are located 5′ and 3′, respectively, within the mouse Gpr56 locus. (B) Zebrafish cmyb in situ staining controls (30 hpf) used for rescue experiments showing normal (green), less/no (blue), and more (red) staining. More staining was classified based on both intensity of staining compared with controls and ectopic cmyb expressing cells in the posterior cardinal vein and caudal hematopoietic tissue as indicated by arrowheads. (C) In situ hybridization with the HSC marker cmyb at 30 hpf. Histogram shows number of embryos in test groups classified as normal, less or no, and more staining. cmyb staining performed on zebrafish control embryos or embryos injected with gpr56 morpholino, or gpr56 morpholino with zebrafish (z)gpr56, mouse (m)Gpr56, mGrp97 (30 ng*), mGpr97, or mGpr114 mRNA (all with 50 ng except *). Number of experiments = 4, 4, 3, 3, 1, 1, and 1, respectively; number of embryos per condition = 92, 67, 56, 65, 15, 22, and 17. (D) Representative images of CD41GFPdimFlt1RFP+ cells (yellow fluorescence) in the caudal hematopoietic tissue (CHT) of gpr56 MO injected and control (WT) double transgenic zebrafish embryos at 48 hpf. CD41, green; Flt1, red; double positive definitive HS/PC, yellow (left). (E) Rescue of HS/PC production as determined by the number of CD41GFPdimFlt1RFP+ cells in the CHT of 48 hpf control, gpr56 morphant zebrafish, and gpr56 morphant zebrafish injected with zgpr56, mGpr56, mGpr97, and mGpr114 RNA was injected. Number of experiments = 2; number of injected and analyzed embryos = 9, 12, 12, 7, 6, and 4, respectively; bars = mean; **P < .01. (F) Percentage of amino acid sequence homology of the 4 domains of mouse Gpr97 vs zebrafish gpr56 and mouse Gpr56. (G) Violin plots showing logExp of Gpr56, Gpr97, and Gpr114 in the 85 CD27+ cells within HC1 (Figure 4F) generated from Vink et al, 2020 single-cell RNA database.38 HC1 CD27+ cells are segregated into subclusters A, B, and C. (H) RT-PCR analysis of relative Gpr97 expression (normalized to β-actin) in days 6 and 10 diferentiated G2V WT and G2V.56KO ESCs from hematopoietic differentiation cultures (same V+cKit+ samples as shown in supplemental Figure 4B for relative Gpr56 expression). n = 3. Mean ± SEM. (I) RT-PCR analysis of relative Gpr97 expression in E9 VECCre:loxGpr56 cKO YS cells (n = 3), E10.5 VavCre:loxGpr56 AGM cells (n = 3), VavCre:loxGpr56 and VECCre:loxGpr56 cKO FL cells (n = 5 and n = 8, respectively) and LSK bone marrow cells (n = 5) from primary recipients of VavCre:loxGpr56 cKO cells. *P ≤ .05.
