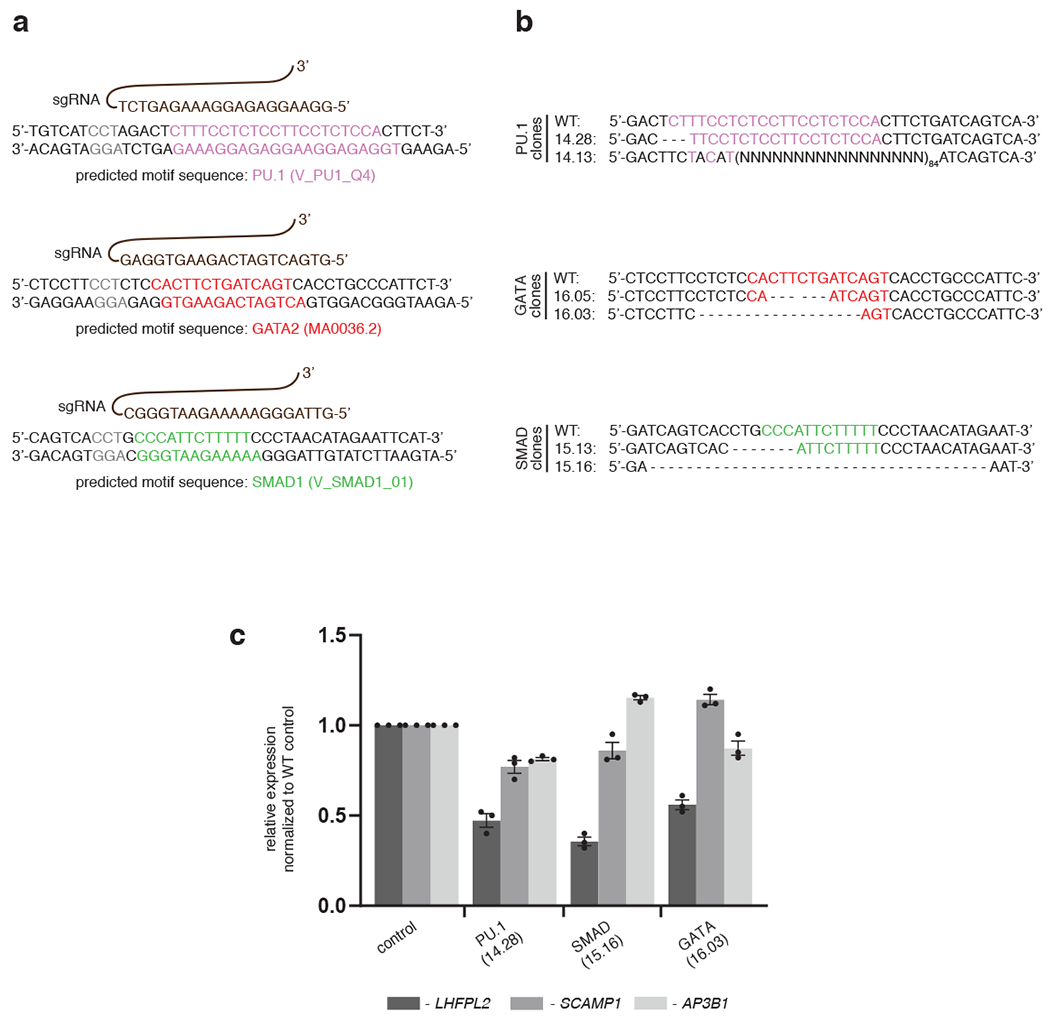
Extended Data Fig. 4: Targeting a TSC near the LHFPL2 gene by CRISPR-CAS9.

a, sgRNAs (shown in brown) targeting specific sequences near PU.1 (pink), GATA (red) and SMAD1 (green) motif-hits within the TSCs. b, Genomic sequences of the specific CRISPR-edited clones are compared against wild-type genomic sequence. Clones 14.13, 16.03 and 15.16 appear to target multiple motifs (i.e. PU.1 and partial GATA; partial PU.1 and partial GATA; SMAD1 and partial GATA). c, qPCR results depicting relative expression of LHFPL2 (black bar) and two other flanking genes (SCAMP1, grey bar and AP3B1, white bar) are shown in different CRISPR clones compared to the WT K562 cells, as indicated. Data represent mean ± SEM from three replicate observations.
