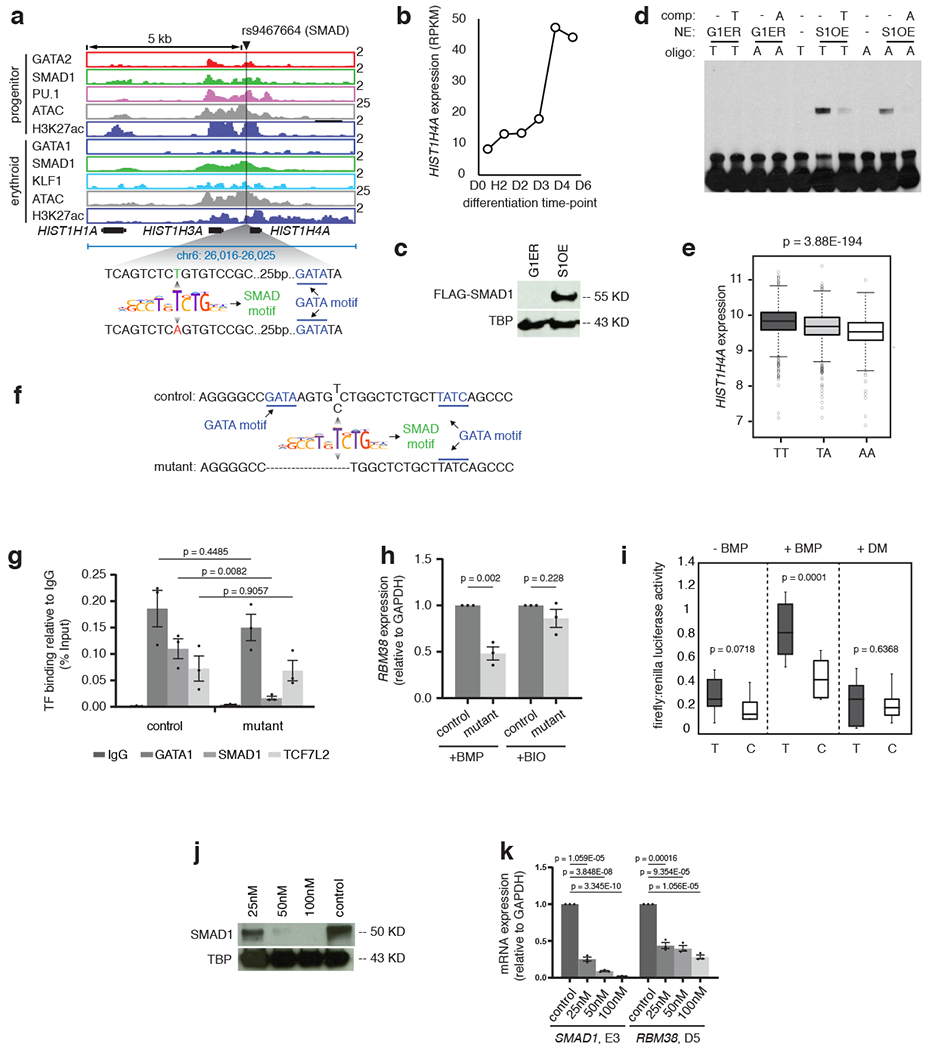
Extended Data Fig. 7: RBC-trait SNPs perturb STF-DNA binding.

a, Binding of GATA2 (red), GATA1 (blue), SMAD1 (green), PU.1 (pink) and KLF1 (light blue) and the peaks of H3K27ac (violet) and ATAC-seq (grey) near HIST1H4A gene are shown in progenitor and differentiated stages. The black line indicates the position of SNP rs9467664. The zoomed in DNA sequence highlights the position of T and A allele relative to the SMAD motif (green) and the nearby GATA motif (blue). Y-axis indicates reads per million. b, RPKM values are shown for the gene HIST1H4A at different stages of CD34+ erythroid differentiation, as indicated. c, Western blot showing the expression of FLAG-SMAD1 protein after treating the SMAD1 overexpressing G1ER cells (S1-FB) with doxycycline (+DOX) for 24 hours. G1ERrepresents the protein extracts from the control parental cell-line. TATA binding protein(TBP) was used as loading control. d, Representative gel-shift assay with the A or T allele of rs9467664. Competitor oligonucleotides have been used in each case to show binding specificity, as indicated and G1ER extracts were used as negative control for the binding assays. S1OE = SMAD1 overexpressing clone. e, HIST1H4A eQTL analysis for the SNP rs9467664 using genotype and gene expression data from the Framingham Heart Study (FHS). Boxplots represent the distribution of HIST1H4Agene expression in individuals with either the TT, TA or AA genotype along with the significance value, as indicated. f, Schematic representation of a K562 clone with altered sequence around rs737092. The deletion is evident in the lower sequence (mutant). g, ChIP-qPCR quantification comparing the binding of GATA1 (blue),SMAD1 (green) and TCF7L2 (orange) between the control WT K562 cells and the K562 cells with RBM38 enhancer deletion. Binding of each factor under each condition is shown with respect to IgG, represented as percentage input (grey). The t-test significance values comparing samples are as indicated. h, qPCR analysis comparing the expression of RBM38 relative to GAPDH between control and mutant K562 clones under BMP and BIO treatment. i, Ratio of firefly and renilla luciferase values without stimulation or with BMP stimulation or with dorsomorphin (DM) stimulation of cells stably transfected with enhancer constructs containing either the T allele or C allele of rs737092. The t-test significance values under each condition are indicated. j, Western blot comparing expression of SMAD1 protein between control shRNA treated CD34+cells and cells treated with 25, 50 and 50 nM SMAD1 shRNA 5 days after differentiation. TATA binding protein (TBP) was used as loading control. k, qPCR analysis comparing the expression of SMAD1 at day 3 of CD34+ expansion (SMAD1,E3) and RBM38 after 5 days of differentiation (RBM38, D5) between control shRNA,25, 50 and 100 nM SMAD1 shRNA treated CD34+ cells. The t-test significance values under each condition are indicated.
