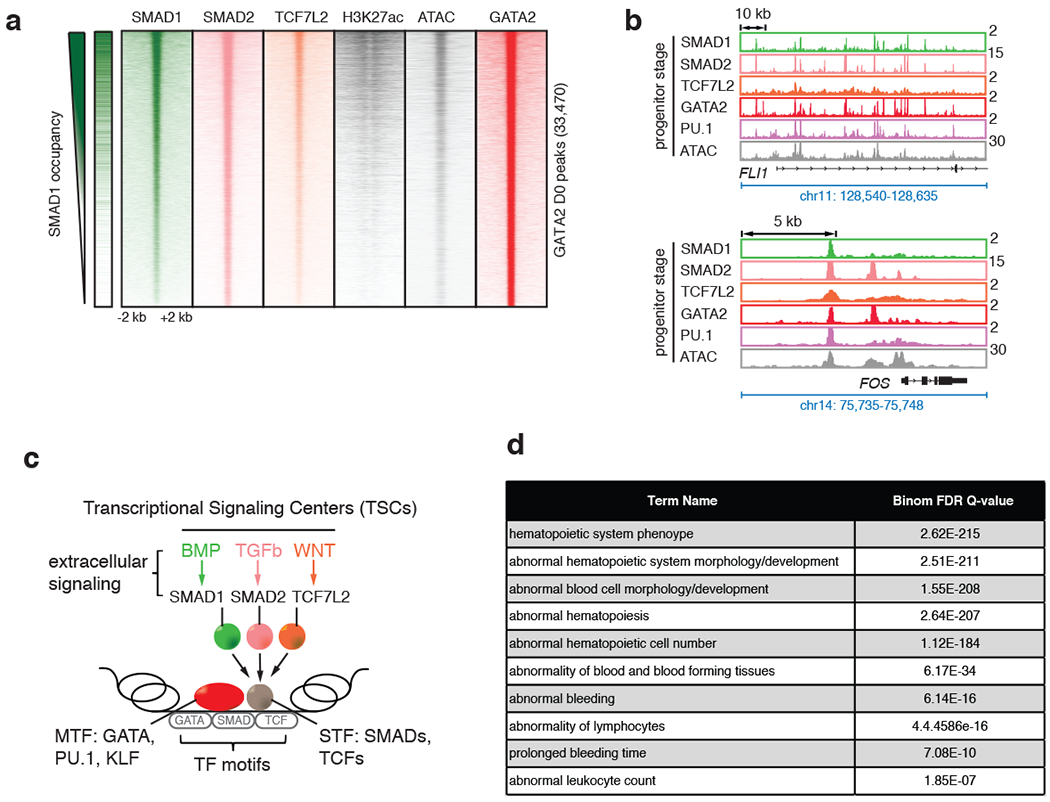
Fig. 3 |. SMAD1+GATA co-bound enhancer regions form Transcriptional Signaling Centers (TSCs).

a, Signal heatmaps representing ChIP-Seq coverage of putative enhancers comprising GATA2 peaks, demonstrating co-occupancy by multiple STFs (SMAD1, green; SMAD2, magenta; and TCF7L2, orange) and MTF (GATA2, red) in progenitor CD34+ cells at D0 upon stimulation with BMP4, TGFβ and WNT signaling, respectively. Regions are considered occupied if they pass a significant coverage cutoff, shown as a binary green/white for SMAD1 heatmap on the left. GATA2 peak numbers obtained at D0 are represented in the Y-axis (33,470). H3K27ac and ATAC-seq heatmaps are also included. b, Representative gene tracks showing peak intensities of SMAD1 (BMP signaling, green), SMAD2 (TGFβ signaling, magenta) and TCF7L2 (WNT signaling, orange), with the master transcription factor GATA2 (red) and ATAC-seq signals at FLI1 and FOS genes at D0. c, Schematic representation of “transcriptional signaling centers (TSCs)”. TSCs are genomic regions that are co-occupied by multiple STFs induced by the respective signaling pathways. TSCs could be signal-specific leading to specific combinations of STFs co-occupying a given region with stage-specific MTFs. d, Human and mouse phenotypes associated with the peaks that are co-bound by SMAD1, SMAD2 and TCF7L2 upon stimulation with BMP4, TGFβ and WNT, respectively, identified using GREAT analysis.
