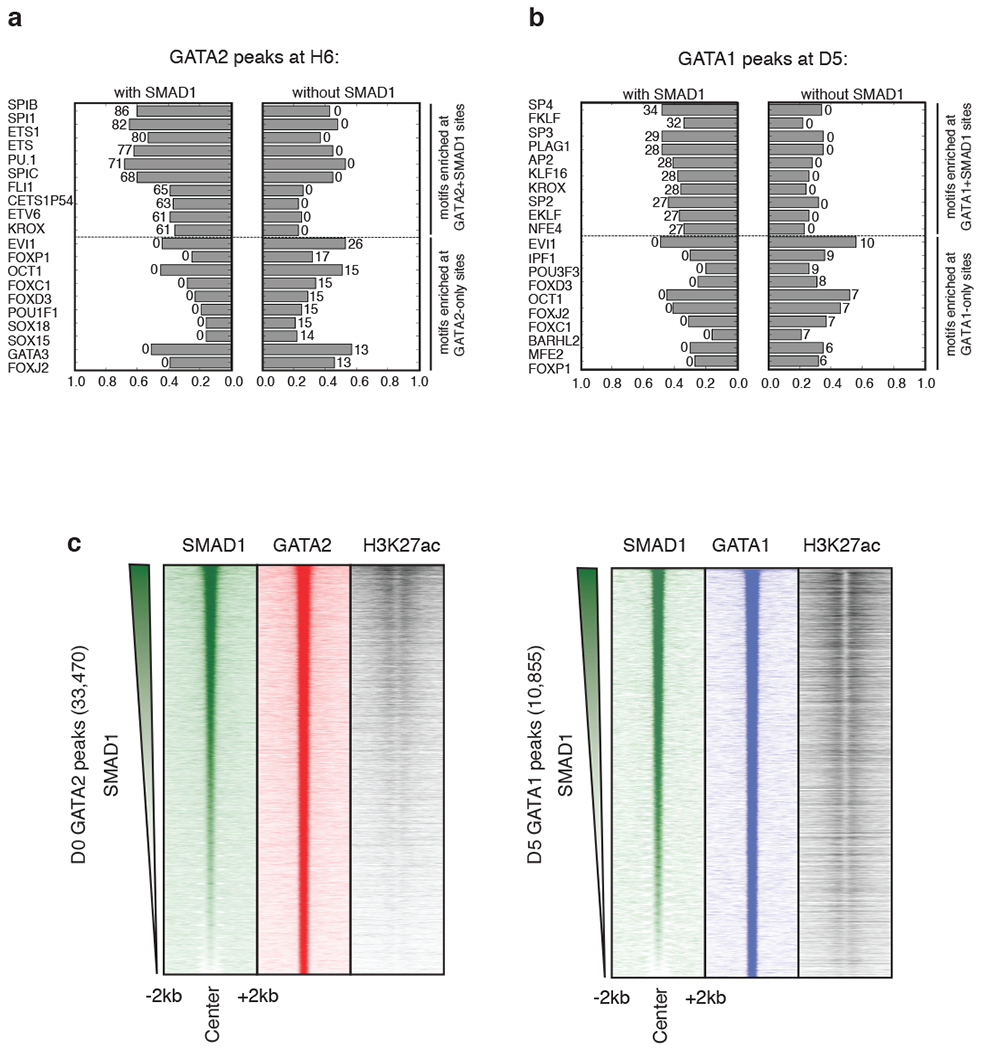
Extended Data Fig. 2: Comparative TF motif enrichment and H3K27ac signal density analysis surrounding GATA+SMAD1 versus GATA-only regions.

Bar charts depicting the enrichment of transcription factor motif hits at regions co-bound by GATA+SMAD1 (left) versus by GATA only (right) at H6 (a) and D5 (b). Length of the bar indicates the fraction of peaks containing a given motif hit, and the number associated with the bar represents the corresponding -log10(p-value) obtained from the hyper-geometric test to assess the significance of motif enrichment. For both (a) and (b), top and bottom of the ranked lists are shown. c, (left panel) Region heatmaps depicting signal of ChIP-seq reads for D0 SMAD1, GATA2 and H3K27ac at 33,470 GATA2 bound peaks at D0. The peaks are ranked by the SMAD1 intensity across the row. Each plot represents signal intensities around +/− 2 kb of the peak center. (right panel) Region heatmaps depicting signal of ChIP-seq reads for D5 SMAD1, GATA1 and H3K27ac at 10,855 GATA1 bound peaks at D5. The peaks are ranked by the SMAD1 intensity across the row. Each plot represents signal intensities around +/− 2 kb of the peak center.
