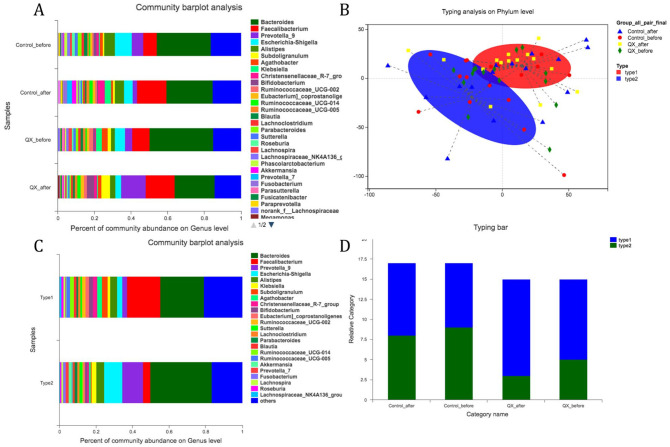
Figure 3.
Community barplot analysis and enterotype analysis in QX and control group. (A) Community barplot analysis for different groups. (B) Micro-biome enterotype typing analysis on Phylum level for samples from both QX and control groups before or after treatments. (C) Community barplot analysis for enterotype 1 and enterotype 2 derived from typing analysis in Figure 2B. (D) Difference on the distribution of enterotype 1 and enterotype 2 in different groups.

