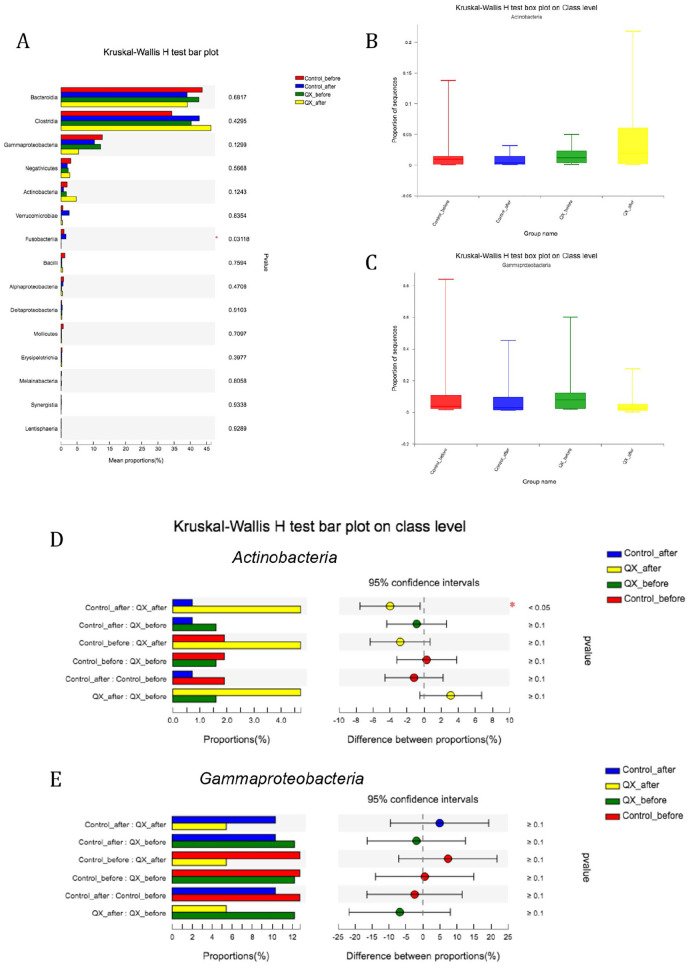
Figure 4.
Difference of community proportions on class level among different groups. (A) Kruskal-Wallis H test bar plot among groups showed that the abundance of Actinobacteria increased in QX group and decreased in control group (P = .12). There was significant difference on the abundance of Fusobacterlia (P = .03), however the value is too minimum in QX group. (B) and (C) Box-plot showing the proportion of Actinobacteria and Gammaproteobacteria among QX and Control groups before and after treatments. (D) and (E) Comparisons between 2 groups for the proportion of Actinobacteria and Gammaproteobacteria. Statistical significance was set at P = .05.

