Figure 2.
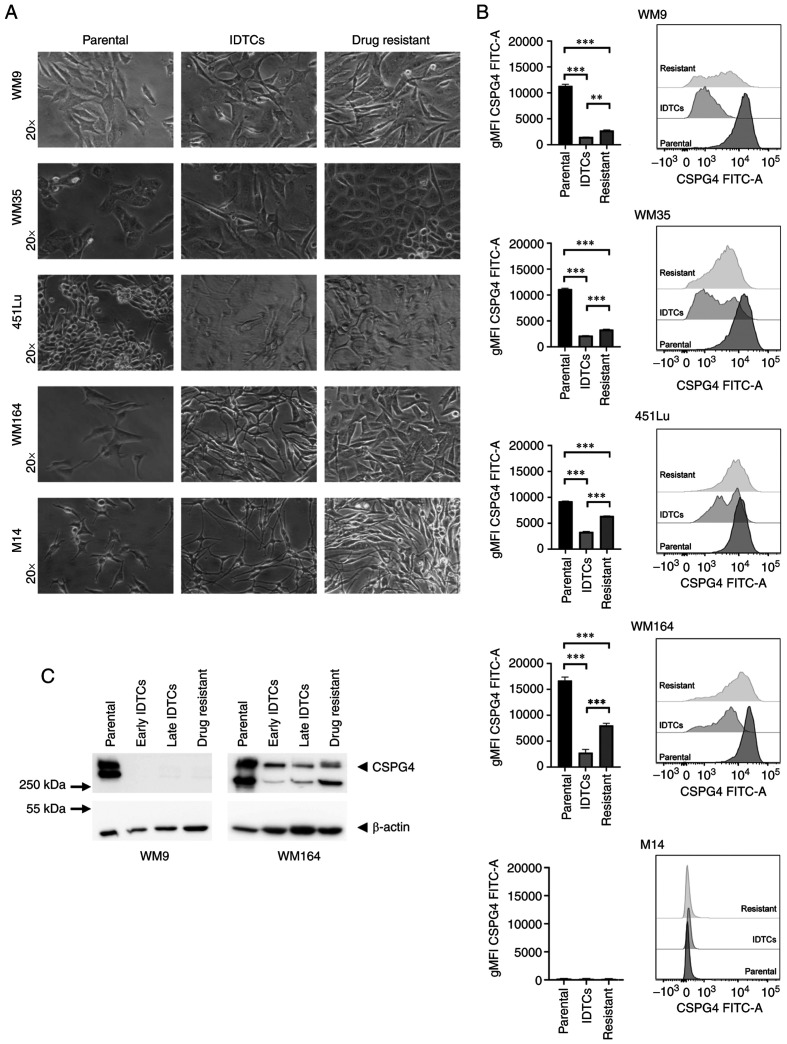
Differences in CSPG4 expression in parental, induced drug-tolerant and drug-resistant melanoma cells. (A) WM9, WM35, 451Lu, WM164 and M14 cells were exposed to PLX4032 in order to generate induced drug-tolerant cells (IDTCs) and drug-resistant cells. The parental cells and corresponding IDTCs and resistant cells were examined by bright-field microscopy and representative photos were taken. (B) The expression of CSPG4 in parental, IDTCs and drug-resistant WM9, WM35, 451Lu, WM164 and M14 cells was evaluated by flow cytometry. Results are presented as geometric mean of fluorescence intensity (gMFI) (left panel) and representative histograms (right panel). Bars represent mean ± SD from triplicates. Statistical analysis was carried out using the one-way ANOVA with Tukey's multiple comparisons test. ***P<0.0001, **P<0.001. (C) Western blot analysis of CSPG4 (280 and 450 kDa) expression in WM9 and WM164 parental, early and late IDTCs as well as drug-resistant cells. β-actin (45 kDa) was used as a loading control. CSPG4, chondroitin sulfate proteoglycan 4; IDTCs, induced-drug tolerant cells.

