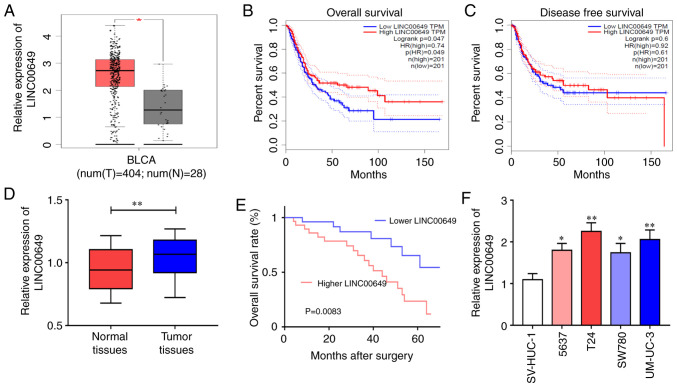
Figure 1.
High LINC00649 expression in BC. (A) LINC00649 expression in BC tissues as analyzed by TCGA database. (B) Association of LINC00649 expression with the OS of BC patients as analyzed by TCGA database. (C) Correlation of LINC00649 expression with the DFS of BC patients as analyzed by TCGA database. (D) LINC00649 expression in BC tissues by RT-qPCR. (E) Analysis of the correlation between LINC00649 and the OS of BC patients. (F) LINC00649 expression in BC cells via RT-qPCR. *P<0.05; **P<0.01.

